Managing Your Dashboard Charts
Once your dashboard has one or more charts, you can manage them on the grid:
Editing and Arranging Charts
- Drag to reposition — click and drag any chart card to move it to a different grid slot.
- Resize — grab the edges or corners of a chart card to resize it within the 12-column grid.
- Edit — click the Edit icon (pencil) on a chart card to reopen the builder/drawer pre-filled with the chart's existing configuration.
- Duplicate — click the Duplicate icon (copy) on a chart card to create a copy with the same configuration in a new grid slot.
- Remove — click the Remove (delete) icon on a chart card to delete it from the dashboard.
- Toggle visibility — hide or show a chart without deleting it from the dashboard.
The grid displays all arranged charts in a 12-column responsive layout. Hidden charts are excluded from the layout until visibility is restored.
Edit Mode
Edit Mode provides a safe scratchpad environment for dashboard layout experimentation. Instead of immediately persisting changes, Edit Mode buffers them until you explicitly save or discard.
Entering Edit Mode
Click the Edit button in the dashboard header to enter Edit Mode:
- Open any custom dashboard
- Click the Edit button in the header
- The dashboard transitions to Edit Mode, showing:
- Grid outlines around chart cards
- Outline borders indicating rearrangeable elements
- New control buttons (Cancel, Save, Discard all)
What Changes Are Buffered
In Edit Mode, all of the following actions are buffered (not immediately persisted):
- Repositioning — Drag & drop to new grid positions
- Resizing — Changing chart dimensions
- Visibility toggles — Showing or hiding charts
- Adding charts — Charts added via the Catalog drawer
- Removing charts — Chart deletions
- Configuration edits — Changes to chart query or display settings
These changes accumulate in a buffer until you explicitly Save or Discard all.
Edit Mode Interface
When Edit Mode is active, the header changes significantly:
| Element | Idle State | Edit Mode State |
|---|---|---|
| Edit toggle | "Edit" button visible | Becomes "Cancel" button |
| Save button | Hidden | "Save" appears (when dirty) |
| Discard all | Hidden | Appears when changes are buffered |
| Add charts | Always visible | Always visible |
| Grid outline | Not visible | Visible around all charts |
Button Behaviors
Cancel
- When visible: Always visible in Edit Mode
- Action: Exits Edit Mode without saving any changes
- Effect: All buffered changes are immediately discarded
- Confirmation: None required (since changes aren't persisted)
- Best for: Quick exit when deciding not to keep changes
Save
- When visible: Only when there are buffered changes (unsaved edits exist)
- Action: Persists all buffered changes to the server
- Effect:
- Applies all drag & drop changes
- Applies all resize changes
- Applies all visibility changes
- Adds/removes charts as configured
- Exits Edit Mode automatically
- Loading state: Shows spinner during save operation
- Error handling: If save fails, Edit Mode remains active and you can retry
Discard all
- When visible: Only when there are buffered changes that haven't been saved yet
- Action: Immediately resets all buffered changes
- Effect:
- All drag & drop positions restored
- All resize dimensions reverted
- All visibility changes undone
- Returns dashboard to last saved state
- Use case: Safely experiment, then discard if not satisfied
- Warning: This action is immediate and cannot be undone
Add charts
- When visible: Always visible (both idle and Edit Mode)
- Action: Opens the Catalog drawer to browse and add new charts
- Important: Added charts are buffered, not saved until you click Save
- Effect: Charts appear in buffer but persist only after Save is clicked
Edit Mode States
Idle State
- Only the "Edit" button is visible
- Charts are in read-only mode
- No grid outline is displayed
- Navigation is straightforward without warnings
Active (With Unsaved Changes) State
- "Cancel", "Save", and "Discard all" buttons are visible
- Buffer accumulates all changes
- Unsaved changes warning activates on navigation
- Grid outlines help visualize layout
Saving State
- Save button shows loading spinner
- All buttons are disabled
- UI prevents further editing
- Shows success/error notification
Unsaved Changes Warning
If you have unsaved changes and attempt to navigate away:
- A modal dialog appears with message: "You have unsaved changes"
- Two options are presented:
- Save & Leave: Persists all changes, then navigates away
- Discard & Leave: Abandons changes and navigates immediately
- Best practice: Use "Save & Leave" to preserve your work
Edit Mode Workflow
Experiment-Satisfied-Save
- Click Edit in the header
- Make changes:
- Rearrange charts via drag & drop
- Resize charts as needed
- Toggle visibility of unnecessary charts
- Add new charts from Catalog
- Modify chart configurations
- If satisfied with changes, click Save
- Changes persist and Edit Mode exits
Experiment-Not Satisfied-Discard
- Click Edit in the header
- Make various experimental changes
- If not satisfied, click Discard all
- Dashboard returns to last saved state
- Start fresh or click Edit again
Quick Preview-No Intent to Save
- Click Edit in the header
- Preview different layouts
- Click Cancel to exit without changes
- All preview changes are discarded
Chart Visibility
Charts can be hidden from view without being removed from the dashboard. This feature is useful for:
- Temporarily hiding charts you're not currently interested in
- Creating a cleaner, more focused view for presentations
- Focusing on specific charts during troubleshooting
- Personalizing your workspace by hiding rarely-used metrics
Hiding Charts
Method 1: Eye Icon on Chart Card
Each chart card has an eye icon toggle for quick hide/show functionality:
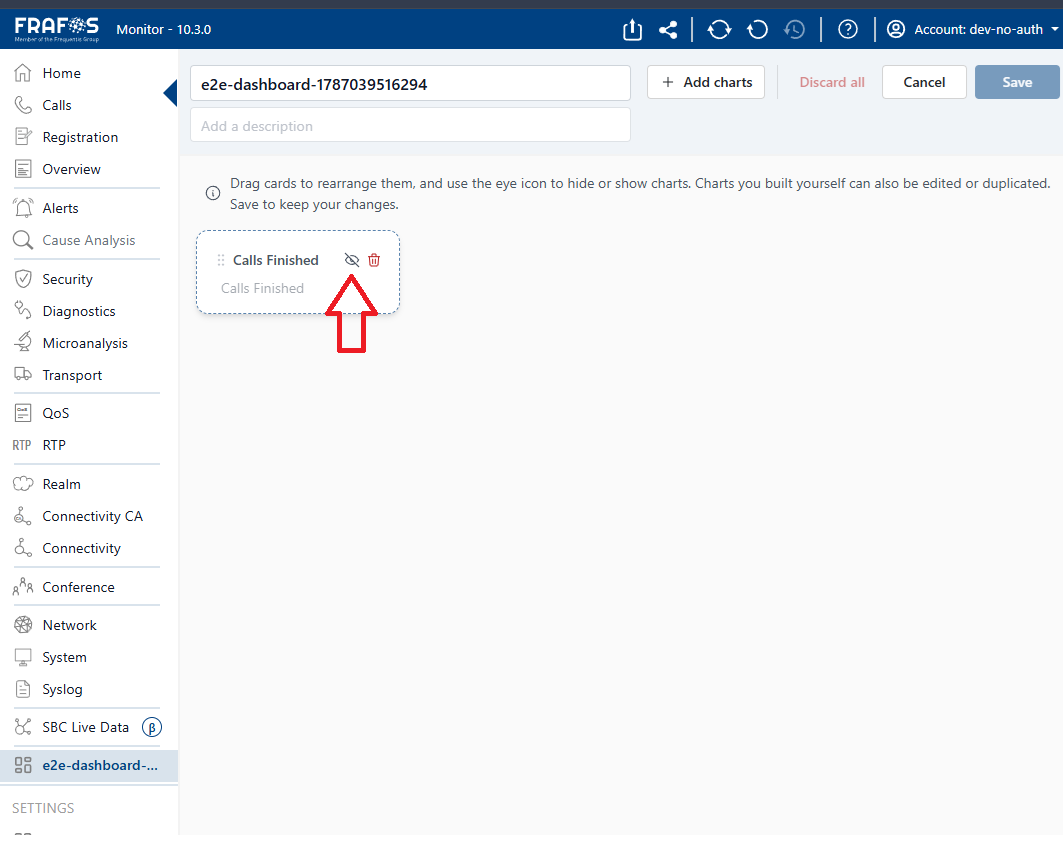
- Enter Edit Mode (click "Edit" in the dashboard header)
- Locate the chart you want to hide
- Click the eye icon in the top-right corner of the chart card
- The chart card immediately disappears from the grid
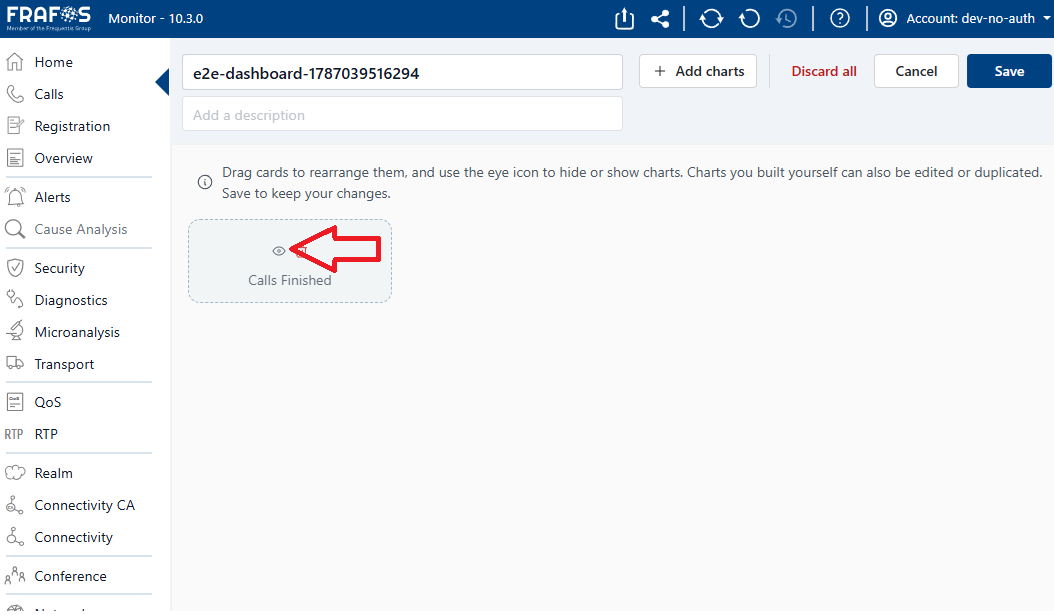
Visual indicators:
- Eye icon = Chart is visible
- Eye-off icon = Chart is hidden from this dashboard
Important notes:
- The chart's configuration and data are preserved
- Hiding a chart does not affect its count toward the 20-chart limit
- Charts can be hidden/unhidden repeatedly
- Changes are buffered during Edit Mode and persist only after clicking Save
Method 2: Dashboard Manager
You can also manage chart visibility from the Dashboard Manager:
- Navigate to Dashboard Manager
- Open the dashboard you want to edit
- Expand individual charts in the table
- Use the visibility checkbox to toggle chart visibility
- Click "Save" in the Dashboard Manager to apply changes
Hidden Charts Indicator
When any charts are hidden, the dashboard header displays a Hidden Charts indicator:
Location and Appearance:
- Position: Top-right of dashboard header, next to the Edit button
- Icon: Eye-off icon crossed out
- Count Badge: Shows the number of currently hidden charts (e.g., "1")
- Tooltip: Hover reveals "X hidden chart(s)"
Interactive dropdown:
- Click the eye-off icon to open the Hidden Charts menu
- Shows a dropdown panel listing all hidden charts for this dashboard
Save Behavior
Visibility changes follow the same buffering rules as other Edit Mode changes:
| Action | Effect on Visibility Changes |
|---|---|
| Toggle eye icon | Buffered, not persisted |
| Click Save | All visibility changes committed |
| Click Cancel | Hidden charts remain hidden until restored |
| Click Discard all | All visibility changes reset |
| Navigate away (unsaved) | Warning: "You have unsaved changes" |
Key points:
- Visibility changes in Edit Mode are buffered until Save
- Hidden charts are tracked in the server-side draft
- Canceling Edit Mode while charts are hidden: hidden state is preserved
- To permanently hide charts, you must save the dashboard layout
- If you restore a chart and then Discard all, it goes back to hidden
Visibility Persistence
Hidden chart state is persisted per user and per dashboard:
What persists:
- Visibility preferences are saved to your user profile
- Hidden charts remain hidden across page refreshes
- Preferences transfer between devices (when logged in)
- Visibility is part of the dashboard "draft" state
What does NOT persist:
- Hidden charts are NOT hidden for other users
- Each user has their own independent visibility state
- System-wide dashboard templates don't inherit visibility
Multi-user implications:
- When you share a dashboard, others see all charts (unless they hide them)
- Your personal hidden charts don't affect what others see
- Visibility is a personal customization, not a dashboard property
Use Cases
Presenting to Stakeholders
Create a tailored view for presentations:
- Enter Edit Mode
- Hide technical detail charts (query performance, API metrics)
- Click Save to apply changes
- Present the dashboard to stakeholders
- They see only the charts you've made visible
- Use Restore all when you need the technical view again
Benefits:
- Professional, focused presentations
- No need to create duplicate dashboards
- Quick switch between executive and technical views
Focusing on Issues
Troubleshoot specific problems without distraction:
- Notice a problem with specific charts
- Hide unrelated charts using their eye icons
- Focus attention on the problematic chart(s)
- Compare and isolate the issue
- Use Restore all when troubleshooting is complete
Workflow:
Full View-Enter Edit Mode-Hide unrelated-Save-
Troubleshoot-Restore all-Full view restored
Personal Workspace Customization
Create a personalized, efficient dashboard:
- Identify rarely-used or low-priority charts
- Hide those charts using eye icons
- Click Save for your personal view
- Navigate to your focused dashboard daily
- Use Restore all for comprehensive reviews
Advanced tip:
- Hide charts that don't apply to your role
- Keep metrics relevant to your KPIs visible
- Different stakeholders may have different ideal views
Temporary Distraction-Free Work
Hide charts that distract during focused work:
- Enter Edit Mode when you need distraction-free time
- Hide social media metrics during deep work
- Keep only core operational metrics visible
- Click Save
- When session ends, use Restore all to get full view back
Edge Cases
No Hidden Charts
When all charts are visible:
- Hidden Charts indicator does NOT appear
- Eye-off icon shows only when any chart could be hidden
- Dropdown menu is empty when no charts are hidden
All Charts Hidden
When every chart is hidden:
- Dashboard shows empty state: "No visible charts"
- Hidden Charts indicator shows full count (e.g., "eye-off icon 20")
- Hidden Charts menu shows all charts with restore options
- "Restore all" is highly useful in this scenario
Max Hidden Charts
With the 20-chart limit:
- Hidden charts still count toward the limit
- You cannot add new charts if you have 20 total (visible + hidden)
- Use "Restore all" to free up capacity for new charts
Conflicting Presets
If you apply a chart preset while some charts are hidden:
- Preset charts are added to your buffer
- Hidden status of existing charts is preserved
- You may exceed the 20-chart visible limit
- Save will fail if preset + existing hidden charts exceed limit
- Error message: "Cannot add more than 20 charts"
Comparison: Edit Mode vs. Dashboard Manager
| Feature | Eye Icon (Edit Mode) | Dashboard Manager |
|---|---|---|
| Location | On chart card | List table |
| Visibility | Requires Edit Mode | View mode accessible |
| Bulk restore | Hidden Charts menu | Manual per chart |
| Preview | See immediate effect | See before changing |
| Other edits | Can do concurrently | Separate interface |
| Best for | Quick toggling | Comprehensive review |
Accessibility
The visibility features include full keyboard and screen reader support:
Keyboard navigation:
- Tab through chart cards to reach eye icons
- Enter or Space to toggle visibility
- Alt + Click for immediate toggle
- Arrow keys navigate Hidden Charts dropdown
- Enter to select restore button
- Escape to close dropdown without changes
Screen reader support:
- Eye icons have proper ARIA labels
- Hidden chart count announced to screen readers
- Chart name included in restore button text
- Status announcements for visibility changes
Focus management:
- Charts receive focus outline when selected
- Dropdown shows focus ring on keyboard navigation
- Restore button clearly indicated with focus state
Tips and Best Practices
Quick toggles:
- Use the eye icon for rapid on/off switching during exploration
- Hold Shift while clicking to toggle without entering Edit Mode (if available)
Bulk operations:
- "Restore all" is your friend when hiding too many charts
- Use Dashboard Manager for systematic visibility auditing
Safe experimentation:
- Experiment with visibility in Edit Mode—it's safe
- All hidden charts can always be restored
- No permanent changes until you click Save
Presentation mode:
- Create presentation-ready views by hiding technical metrics
- Always test your presentation view before meetings
Personal optimization:
- Regularly review which charts you hide most often
- Consider creating multiple dashboards for different use cases
Team coordination:
- Document which charts you've hidden for your team
- Communicate when you're using a "focused" view
- Consider team conventions for visibility patterns
Related Features
- Static Mode: Locks chart positions for presentations and fixed layouts
- Edit Mode: Changes to visibility are buffered until Save
- Dashboard Manager: Alternative way to manage visibility
- Chart limits: Hidden charts still count toward the 20 chart limit
- Unsaved changes: Hiding/showing charts triggers dirty state
Keyboard Shortcuts
While in Edit Mode, you can use these shortcuts for visibility:
| Shortcut | Action |
|---|---|
| E (on chart focus) | Toggle visibility |
| H (global) | Open Hidden Charts dropdown |
| R (in dropdown) | Restore selected chart |
| A (in dropdown) | Restore all charts |
Always verify shortcuts in the actual UI as they may vary based on accessibility settings
Saving and Persistence
Where Dashboards Are Stored
- Custom dashboards are stored server-side in your user profile
- Each dashboard has a unique identifier and is associated with your account
- Changes sync automatically when you save
Save Mechanism
- Clicking Save in Edit Mode triggers an
updateUserProfileAPI call - The entire dashboard layout is sent to the server atomically
- On success: changes persist and Edit Mode exits
- On failure: Edit Mode remains active for retry
Auto-Sync Behavior
- In Edit Mode, changes are NOT auto-synced
- They only persist when you explicitly click Save
- This prevents accidental layout changes from being immediately committed
- Auto-sync applies only when exiting Edit Mode via navigation (if you choose to save)
Related Content
Creating a Dashboard — Learn how to create and duplicate dashboards Edit Mode Deep Dive — Comprehensive guide to Edit Mode, including all button behaviors and states Dashboard Manager — Full CRUD management of dashboards Adding Charts from Catalog — How to add new charts to your dashboard
Static Mode
Static Mode is a powerful feature that locks chart positions in place, preventing them from rearranging when you resize the browser, add new charts, or remove existing ones. It's designed for creating stable, presentation-ready dashboards with fixed layouts.
What is Static Mode?
Static Mode changes the grid behavior from fluid (charts can move freely) to fixed (charts are pinned to their exact grid positions). When enabled:
- Charts are locked to their current grid slots
- Resizing the browser window does not rearrange charts
- Dragging a chart does not push other charts aside
- Adding new charts requires pre-existing empty grid slots
- Removing charts leaves gaps that don't automatically fill
Static Mode OFF (Default)-Fluid layout
- Charts can rearrange freely
- Grid adapts to changes
- Good for: Creating layouts, experimenting

Static Mode ON-Fixed layout
- Charts are pinned in place
When to Use Static Mode
Ideal Use Cases
-
Stakeholder Presentations
- You've carefully arranged charts for a specific audience
- You don't want the layout to shift during a live presentation
- Example: Executive dashboard shown in board meetings
-
Kiosk or Dashboard Displays
- Dashboard is shown on a wall-mounted screen
- Layout must remain constant regardless of browser size
- Multiple users view the same dashboard simultaneously
-
Shared Team Dashboards
- Dashboard is shared across a team
- You want everyone to see the same fixed layout
- Prevents accidental rearrangement by viewers
-
Documentation and Tutorials
- Creating step-by-step guides with consistent layouts
- Screenshot-based documentation requiring stable positions
- Training materials with visual consistency
-
Monitoring Dashboards
- Always-on monitoring screens in operations centers
- Specific charts must always appear in designated positions
- Prevents layout drift over time
How Static Mode Works
Static Mode is controlled through the Edit Mode interface:
- Open any custom dashboard
- Click Edit in the dashboard header
- Look for the Static Mode toggle in the Edit Mode toolbar
- Toggle it ON to lock chart positions
The Static Mode toggle appears in the Edit Mode header, typically near the Save/Cancel buttons.
Toggle states:
| State | Visual | Behavior |
|---|---|---|
| OFF | Gray/disabled icon | Charts can rearrange freely |
| ON | Blue/active icon | Charts are pinned in place |
Static Mode Behavior
With Static Mode OFF (Default)
When Static Mode is disabled (default behavior), the dashboard grid is fluid:
- Chart Movement: Dragging a chart pushes adjacent charts aside; charts flow naturally to fill available space
- Browser Resize: Charts automatically rearrange to fit window changes
- Adding/Removing Charts: New charts fit into available grid spaces; gaps are automatically filled by remaining charts
- Best for: Initial layout creation, experimental rearrangement, adaptive/responsive viewing
With Static Mode ON
When Static Mode is enabled, the dashboard grid becomes fixed:
- Chart Movement: Charts are locked to their exact grid positions; dragging does NOT move other charts
- Browser Resize: Charts maintain their exact positions; no automatic rearrangement occurs
- Adding/Removing Charts: New charts require pre-existing empty grid slots; removing a chart leaves a permanent gap
- Best for: Presentation-ready layouts, fixed displays, team-shared dashboards, documentation screenshots
Comparison Table
| Behavior | Static Mode OFF (Fluid) | Static Mode ON (Fixed) |
|---|---|---|
| Drag chart | Other charts shift to make room | Other charts stay in place |
| Resize browser | Charts rearrange automatically | Charts maintain positions |
| Add new chart | Inserts into available space | Fails if no empty slot exists |
| Remove chart | Other charts fill the gap | Gap remains empty |
| Chart positions | Can change freely | Locked in place |
| Best use case | Experimentation, creation | Presentations, fixed displays |
Common Issues & Solutions
Issue: Can't Move a Chart
Problem: You're trying to rearrange charts but they won't move.
Solution: Static Mode is likely ON, locking all chart positions.
- Enter Edit Mode
- Toggle Static Mode OFF
- Charts can now be moved freely
Issue: Charts Keep Rearranging
Problem: Your carefully arranged charts keep shifting when you resize the browser.
Solution: Static Mode is OFF.
- Enter Edit Mode
- Toggle Static Mode ON
- Charts are now locked in place
Issue: Can't Add New Chart
Problem: You want to add a new chart but nothing happens when you try.
Solution: Static Mode is ON and all grid slots are filled.
- Disable Static Mode temporarily
- Rearrange charts to make space
- Add new chart
- Re-enable Static Mode if needed
- Save your work
Issue: Gap Looks Bad After Removing Chart
Problem: You removed a chart in Static Mode, leaving an ugly empty gap.
Solution:
- Fill the gap: Add a new chart to that slot
- Disable Static Mode: Toggle it OFF, save the changes
- Accept the gap: Sometimes empty space is intentional for future use
Best Practices
-
Create First, Lock Later
- Start with Static Mode OFF for flexible creation
- Only enable Static Mode when satisfied with layout
-
Test Before Presenting
- Verify that charts don't move when dragging
- Check that browser resize doesn't affect layout
-
Save After Enabling
- Once Static Mode is ON and tested, click Save
- This persists your fixed layout for all users
-
Plan for Future Changes
- Leave intentional gaps for anticipated additions
- Don't maximize chart count if you expect growth
-
Use for Presentations
- Static Mode is ideal for stakeholder presentations
- Prevents layout drift during live demos
Advanced Dashboard Features
In addition to Static Mode, dashboards offer several advanced features for management and collaboration.
Duplicate Dashboard
Create an exact copy of an existing dashboard with all its charts, layout, and settings.
Location: Dashboard Manager menu for a dashboard
Steps:
- Navigate to Dashboard Manager
- Find the dashboard you want to duplicate
- Click the Actions menu
- Select Duplicate
- Enter a name for the copy (prefixed with "Copy of ")
- Click Create
What is Preserved:
- All charts with their configurations
- Dashboard layout (positions, sizes)
- Chart visibility settings
- Dashboard name and description
- Static Mode state (if enabled)
What is NOT Preserved:
- Dashboard owner/permissions
- Custom sharing settings
- User-specific visibility preferences
Use Cases:
- Template creation: Duplicate and modify as a template for similar dashboards
- Safe experimentation: Create a copy to test major changes
- Branching: Maintain multiple versions of similar dashboards
- Team sharing: Create copies for different team members
Example:
Original: "Q3 Sales Dashboard"
Duplicate: "Copy of Q3 Sales Dashboard"
Dashboard Sharing
Share dashboards with team members through links or embedded views.
Location: Dashboard Manager-Actions menu-Share options
Share Options:
-
Share Link
- Generates a URL that can be shared
- Format:
http://dashboard-url/dashboards/{dashboard-id} - Recipients need appropriate permissions to view
-
Embed Code
- Provides HTML embed code for external sites
- Includes responsive iframe configuration
- Can be used in internal wikis, reports, portals
-
Export JSON
- Download dashboard as a JSON file
- Can be imported into another instance
- Useful for backups or migration
Permissions:
- Viewer: Can view but not edit
- Editor: Can edit the dashboard (if shared as editable)
- Admin: Full control (dashboard owner default)
Security Considerations:
- Shared links can be forwarded (not encrypted)
- Set appropriate permission levels
- Review who has access regularly
- Disable sharing when dashboard is sensitive
Export & Import
Export dashboards to JSON files and import them into other dashboard instances.
Export Format:
{
  "dashboard": {
    "id": "unique-id",
    "name": "Dashboard Name",
    "charts": [...],
    "layout": {...}
  }
}
Export Steps:
- Open Dashboard Manager
- Click Actions (menu) on desired dashboard
- Select Export
- Download the JSON file
- Save for backup or transfer
Import Steps:
- Open Dashboard Manager
- Click Import button
- Upload the JSON file
- Optionally rename the imported dashboard
- Confirm import
Use Cases:
- Backup: Regular export for disaster recovery
- Migration: Move dashboards between environments
- Template Sharing: Share layouts with other teams
- Version Control: Store dashboard definitions in Git
Limitations:
- May not work across major version upgrades
- User-specific settings may not transfer
- Custom data source connections need reconfiguration
- Some chart types may require updates
Dashboard Templates
Create templates from existing dashboards for reuse.
Creating a Template:
- Design your ideal dashboard layout
- Add all desired charts
- Enable Static Mode for fixed layout
- Save the dashboard
- Use as a starting point for new dashboards
Template Workflow:
Design Template-Save-Create New-
Select Template-Customize-Save as New Dashboard
Benefits:
- Consistent layouts across team
- Reduced setup time for new dashboards
- Standardized metrics and visualizations
- Best practices built into templates
Time Range Persistence
Custom time ranges are saved per dashboard and persist across sessions.
Time Range Options:
- Last 24 hours (default)
- Last 7 days
- Last 30 days
- Last 90 days
- Last year
- Custom range (date picker)
Persistence Behavior:
- Each dashboard remembers its last time range
- Users can set personal defaults
- Time range persists after page refresh
- Different users can have different defaults
Setting Time Range:
- Open dashboard
- Click time range selector in header
- Choose preset or custom range
- Selection persists for future sessions
Summary
This comprehensive guide covers:
- Managing Charts: Arrangement, resizing, visibility toggles
- Edit Mode: Safe experimentation with buffered changes
- Unsaved Changes: Warning system for accidental navigation
- Static Mode: Fixed layouts for presentations and displays
- Advanced Features: Duplicate, share, export/import, templates, time range
These features work together to provide a powerful dashboard customization experience that adapts to your needs, from casual experimentation to production-ready presentations.