Syslog Dashboard
Monitor the incoming system logs with the Syslog Dashboard. View detailed logs, filter by severity, and analyze trends to identify issues.
- Overview
- Syslog Over Time
- Severities
- Hosts
- Applications
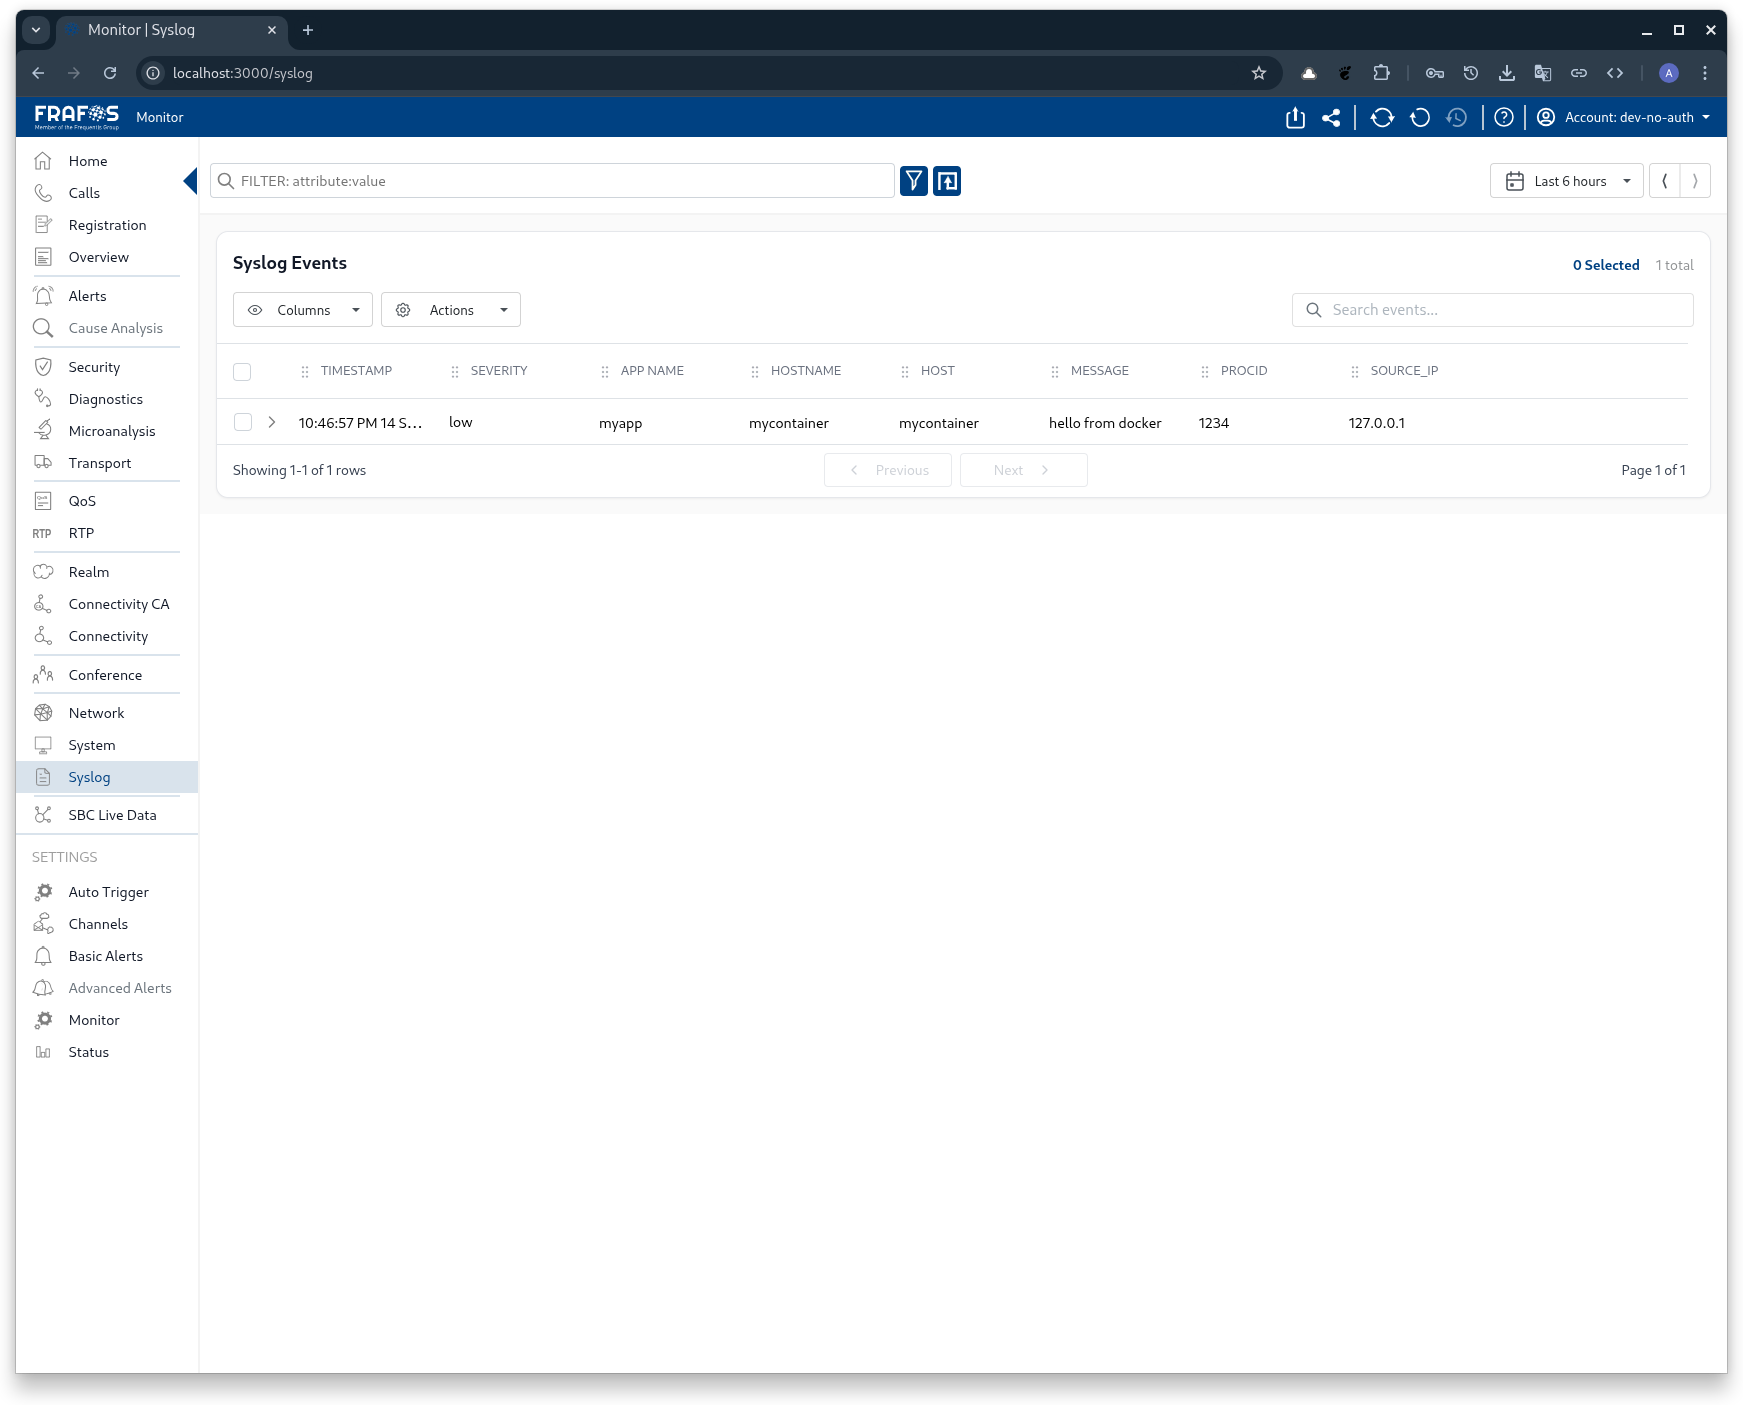
Quick overview of incoming logs, recent alerts, and a summary of log volume.
Use this to get a fast status check of logging activity across your systems.
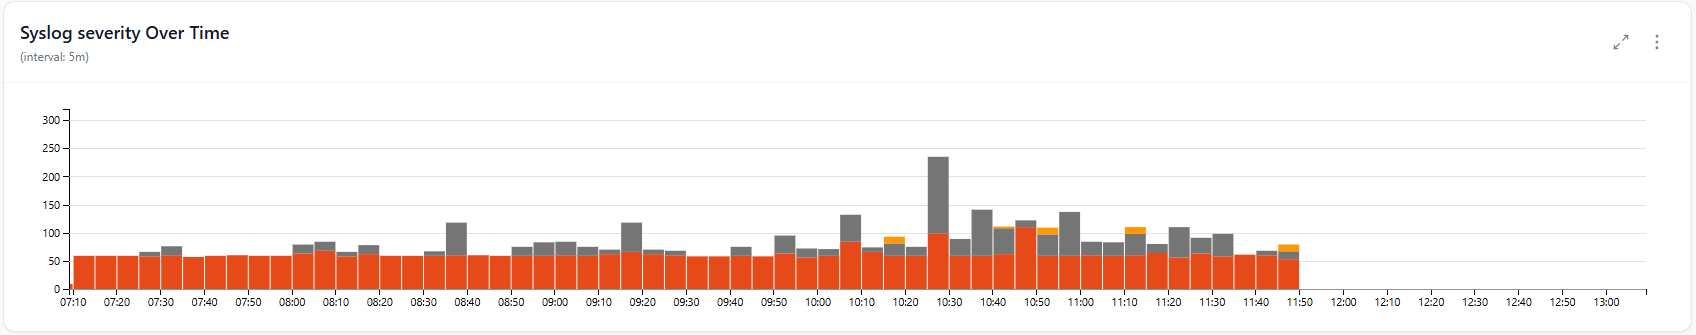
Displays the volume of syslog messages over time to spot spikes and trends.
Correlate spikes with deployments or infrastructure events for faster root cause analysis.
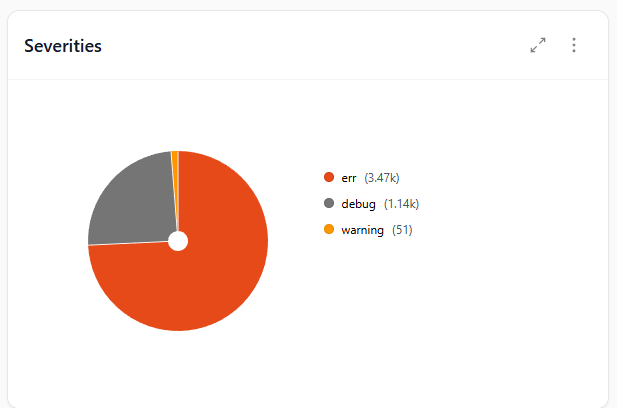
Breakdown of log messages by severity (e.g., Debug, Info, Warning, Error, Critical).
Filtering by severity helps prioritize investigation and alerting.

List of hosts generating syslog messages, useful to identify noisy or problematic machines.
Investigate hosts with sudden increases in log volume or error counts.

Shows applications or services producing log entries, enabling service-level troubleshooting.
Use this to spot misbehaving services or misconfigurations that flood logs.