Calls Dashboard
Welcome to the Calls Dashboard! This page provides insights into call activity, quality, and trends. Use the tabs below to explore each metric in detail.
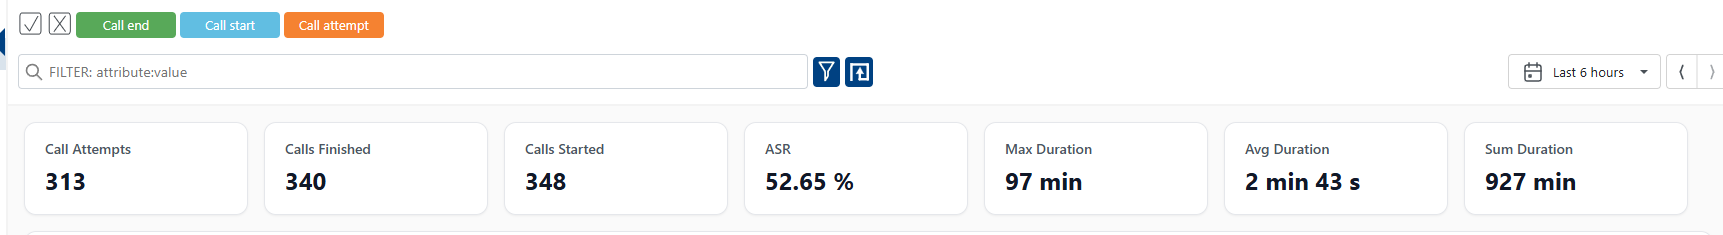
Main Cards Overview:
- CALL ATTEMPTS: Total number of call attempts, including both successful and failed calls.
- CALLS FINISHED: Number of calls that have completed (ended successfully or otherwise).
- CALLS STARTED: Number of calls that have been initiated.
- ASR: Answer-Seizure Ratio, the percentage of successfully connected calls out of all attempts.
- MAX DURATION: The longest duration among all completed calls.
- AVG DURATION: The average duration of completed calls.
- SUM DURATION: The total duration of all completed calls combined.
- DISTINCT FROM URI: Number of unique SIP From URIs observed in call events.
- Events Over Time with ASR
- Sum Duration Over Time
- Call Success Ratio
- SIP-Code
- Call Terminated
- Calling Countries
- Duration Group
- Call Events
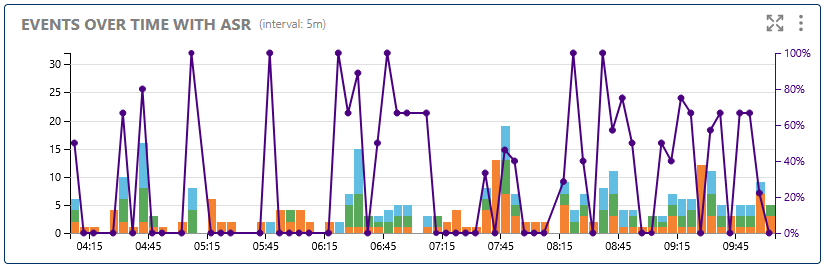
This chart displays the number of call events (such as call attempts, connections, and terminations) over time. The ASR (Answer-Seizure Ratio) overlay helps you monitor the proportion of successful calls, making it easier to spot issues with call completion rates during specific periods.
Shows the number of call events over time, with Answer-Seizure Ratio (ASR) overlay to monitor call success rates.

This visualization tracks the total duration of all calls within each time window. It helps identify periods of high usage, long calls, or potential network congestion, and is useful for capacity planning and trend analysis.
Displays the total duration of all calls in each time period, helping you spot usage peaks and trends.
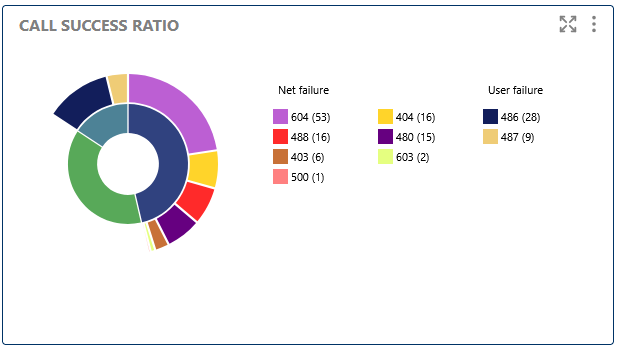
The Call Success Ratio (ASR) is a key VoIP quality metric, showing the percentage of calls that were successfully connected out of all attempts. A low ASR may indicate network issues, misconfigurations, or external problems affecting call completion.
Visualizes the ratio of successful calls to total attempts, a key VoIP quality metric.
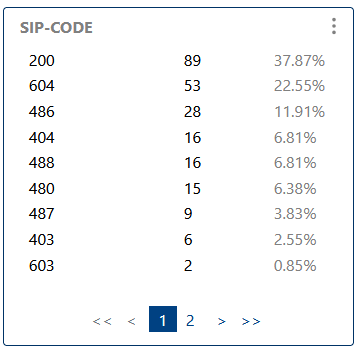
This section breaks down call results by SIP response codes (e.g., 200 OK, 404 Not Found, 486 Busy Here). Analyzing SIP codes helps diagnose call failures, user errors, or network problems, and can reveal patterns in call handling.
Breaks down call outcomes by SIP response codes, helping diagnose call failures and network issues.
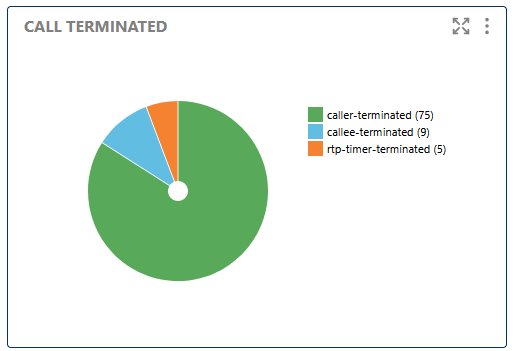
Here you can see statistics on calls that were terminated, including the reasons (such as user hangup, network error, or timeout) and their frequency. This helps identify abnormal call drops or user behavior.
Highlights calls that were terminated, including reasons and frequency.
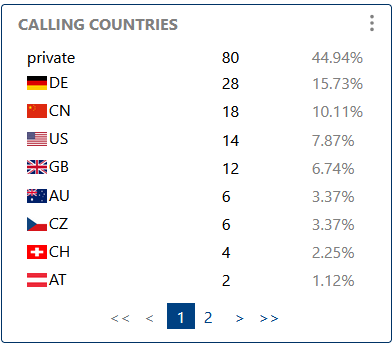
This visualization shows the geographic distribution of call origins and destinations. It helps you understand international call patterns, detect unusual activity, or monitor compliance with regional policies.
Shows the distribution of call origins and destinations by country.

Calls are grouped by duration ranges (e.g., short, medium, long). This analysis helps spot trends in call length, detect abnormal usage, or optimize billing and resource allocation.
Groups calls by duration ranges to analyze call length patterns.
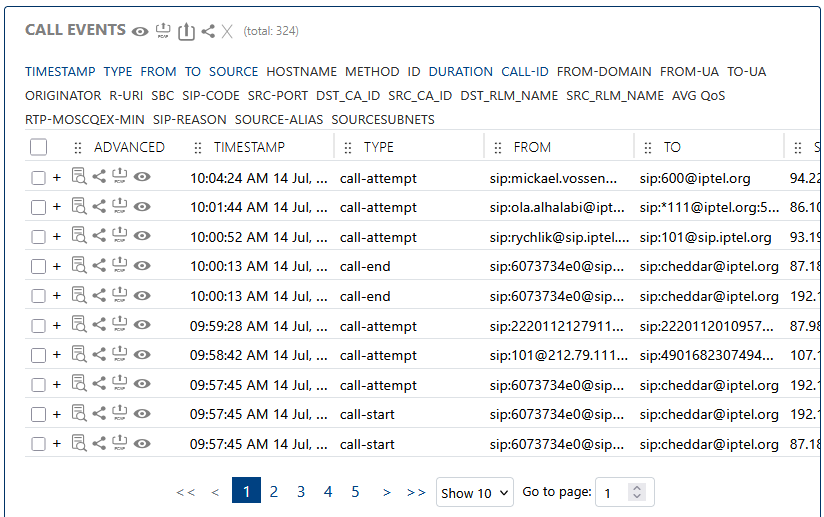
This section lists individual call events with detailed information for each. Use it for troubleshooting, auditing, or investigating specific call scenarios.
Lists individual call events for detailed inspection and troubleshooting.