RTP Dashboard
Welcome to the RTP (Real-time Transport Protocol) Dashboard! This page provides insights into media stream quality, network performance, and RTP event analysis. Use the tabs below to explore each metric in detail.
- Top Remote CA
- Top Remote IP
- Sent/Received Bytes
- Sent/Received Packets
- Jitter (recv)
- Lost (recv)
- Gaps (recv)
- Running Calls
- RTP Events

Shows the most active remote Call-Agents (CAs) in RTP streams, helping you identify key peers and traffic sources.
Use this to monitor which remote CAs are most involved in media sessions.
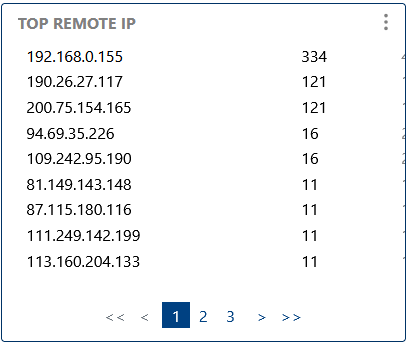
Highlights the most frequent remote IP addresses in RTP traffic, useful for tracking endpoints and detecting anomalies.
Spot high-traffic or suspicious IPs in your RTP streams.

Displays the total bytes sent and received, helping you analyze bandwidth usage and detect imbalances.
Monitor bandwidth trends to optimize network performance.
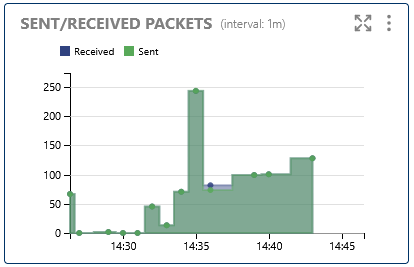
Shows the number of RTP packets sent and received, useful for packet loss analysis and troubleshooting.
Use this to detect packet loss or transmission issues.
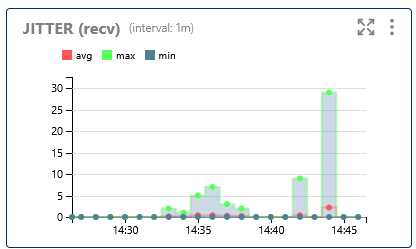
Visualizes jitter (variation in packet arrival time) for received RTP streams, a key metric for call quality.
High jitter can cause audio distortion or dropouts.

Shows the number of lost RTP packets on the receiving side, helping you identify network issues or congestion.
Packet loss directly impacts call quality and reliability.

Displays detected gaps in received RTP streams, which may indicate network instability or severe packet loss.
Frequent gaps can lead to choppy audio or call drops.

Shows the number of active RTP sessions, helping you monitor system load and concurrent call volume.
Use this to track real-time call activity and resource usage.
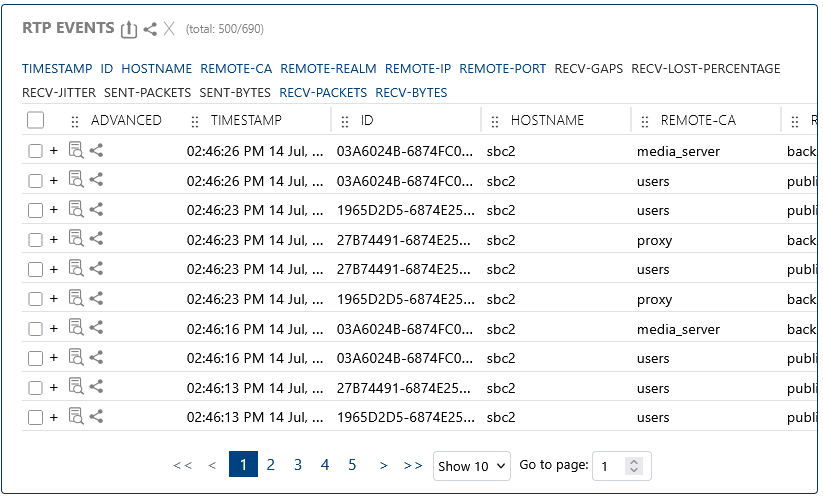
Lists individual RTP events for detailed inspection, troubleshooting, and quality analysis.
Review RTP events to investigate call quality issues and network behavior.