Node Exporter Sidecar
The prom/node-exporter sidecar collects host-level metrics — CPU, memory, disk, and network — from the physical machine running your FRAFOS Monitor stack. These metrics are exposed at :9100/metrics and scraped by Prometheus for dashboards and alerting.
This sidecar measures the underlying host resources, not the application itself. While Monitor dashboards show SBC-level data (calls, registrations, SIP transactions), node-exporter shows whether the host has enough CPU, RAM, or disk to keep those services running.
What it monitors
| Resource | Key Metrics | Example Use Cases |
|---|---|---|
| CPU | node_cpu_seconds_total, node_load1/5/15 | Spikes, sustained load, capacity |
| Memory | node_memory_MemTotal_bytes, node_memory_MemAvailable_bytes | OOM risk, cache pressure |
| Disk | node_filesystem_avail_bytes, node_filesystem_size_bytes | FS fills, partition sizing |
| Network | node_network_receive_bytes_total, node_network_transmit_bytes_total | Traffic, drops, interface-level debugging |
Deployment model: one per physical host
Deploy exactly one node-exporter sidecar per physical host — regardless of how many SBC/CCM/monitoring containers are running on that machine.
| Your setup | Sidecars needed |
|---|---|
| SBC + CCM + Monitor all on one physical host | 1 sidecar |
| SBC on Host A, CCM on Host B, Monitor on Host A | 2 sidecars (one per physical host) |
| 10 SBCs on a single physical host | 1 sidecar |
Each sidecar only knows about its own physical host. Prometheus must discover and scrape each endpoint independently. There is no clustering, aggregation, or shared state between sidecars.
Architecture
node-exporter measures the resources of the physical host (CPU, RAM, disk, network interfaces). It must be deployed on the physical server — not inside a Docker container that runs on top of it.
If your VOIP cluster spans 2 physical hosts, you must deploy 2 sidecars — one per physical host, each monitoring its own underlying hardware.
Deployment topology
The diagram below shows a two-physical-host deployment. Each physical server runs its own node-exporter sidecar that Prometheus scrapes on port 9100. Containers (SBC, CCM, Monitor) on the same host share that host's sidecar — there is one sidecar per physical host, not per container.
One sidecar per physical host — whether that host runs 1 SBC or 10 SBCs, it needs only one node-exporter. Prometheus scrapes each host on port 9100 independently.
Metrics data flow
Docker Compose
The container mount /:/hostfs:ro,rslave and privileged: true are required. The privileged flag gives access to kernel-level counters; rslave propagation makes sub-mounts (e.g. /var/lib/docker/overlay) visible inside the container.
- Compose
- Podman
- Kubernetes
node-exporter:
  image: prom/node-exporter:v1.11.1
  container_name: node-exporter
  network_mode: host          # or bridge + ports: "9100:9100"
  privileged: true
  command: ["--path.rootfs=/hostfs"]
  volumes:
    - /:/hostfs:ro,rslave
  profiles:
    - monitoring
Host networking (production)
Use network_mode: host to bind :9100 directly on the host's IP. No port mapping needed.
Bridge networking (development)
Replace network_mode: host with a port mapping for access from localhost:
# instead of: network_mode: host
ports:
  - "9100:9100"
networks:
  - monitoring
Podman runs the same Compose file via podman-compose. Add the service to your compose file, then:
# Bring up the sidecar
podman-compose up -d node-exporter

# Verify it's running
podman ps | grep node-exporter
podman logs node-exporter
The network_mode: host mapping is equivalent to Podman's --network host flag. To bind a mapped port:
podman run -d -p 9100:9100 \
  --privileged \
  -v /:/hostfs:ro,rslave \
  --name node-exporter \
  prom/node-exporter:v1.11.1 \
  --path.rootfs=/hostfs
apiVersion: apps/v1
kind: Deployment
metadata:
  name: node-exporter
spec:
  replicas: 1
  selector:
    matchLabels:
      app: node-exporter
  template:
    metadata:
      labels:
        app: node-exporter
    spec:
      hostNetwork: true
      hostPID: true
      containers:
        - name: node-exporter
          image: prom/node-exporter:v1.11.1
          args: ["--path.rootfs=/hostfs"]
          ports:
            - containerPort: 9100
          securityContext:
            privileged: true
          volumeMounts:
            - name: hostfs
              mountPath: /hostfs
              readOnly: true
              mountPropagation: "HostToContainer"
          resources:
            limits:
              memory: "64Mi"
              cpu: "100m"
            requests:
              memory: "16Mi"
              cpu: "50m"
      volumes:
        - name: hostfs
          hostPath:
            path: /
Cluster-wide coverage (DaemonSet)
For all nodes in a Kubernetes cluster, use a DaemonSet instead of a Deployment so one pod runs per node:
apiVersion: apps/v1
kind: DaemonSet
metadata:
  name: node-exporter
  namespace: monitoring
  labels:
    app: node-exporter
spec:
  selector:
    matchLabels:
      app: node-exporter
  template:
    metadata:
      labels:
        app: node-exporter
    spec:
      hostNetwork: true
      hostPID: true
      containers:
        - name: node-exporter
          image: prom/node-exporter:v1.11.1
          args: ["--path.rootfs=/hostfs"]
          ports:
            - containerPort: 9100
          securityContext:
            privileged: true
          volumeMounts:
            - name: hostfs
              mountPath: /hostfs
              readOnly: true
              mountPropagation: "HostToContainer"
      volumes:
        - name: hostfs
          hostPath:
            path: /
Host mount propagation
The bind mount /:/hostfs:ro (Docker) or hostPath (K8s HostToContainer) exposes the host's entire filesystem tree to the container. For sub-mounts (e.g. /data, /var/lib/docker/overlay) to be visible, the host root mount must have shared propagation.
systemd-based Linux
sudo mount --make-rshared /
Validation
Verify the sidecar is healthy with a single command:
- Compose
- Podman
- Kubernetes
The Compose YAML also works with Podman via podman-compose. Bring up the single sidecar and verify:
# From the Compose project root:
podman-compose up -d node-exporter
sleep 5 && curl -s http://localhost:9100/metrics | head -5
Expected output:
# HELP node_load1 1m load average.
# TYPE node_load1 gauge
node_load1 0.91
Without a Compose file, run the sidecar directly:
podman run --rm -d \
  --network host \
  --privileged \
  -v /:/hostfs:ro,rslave \
  --name node-exporter \
  prom/node-exporter:v1.11.1 \
  --path.rootfs=/hostfs

sleep 5 && curl -s http://localhost:9100/metrics | head -5
kubectl get pods -l app=node-exporter
kubectl logs -l app=node-exporter --tail=20
Then port-forward and curl:
kubectl port-forward deploy/node-exporter 9100:9100 &
curl -s http://localhost:9100/metrics | head -5
A healthy deployment returns HTTP 200 with metric data and no errors in logs.
Prometheus scrape config
The node-exporter targets are not manually configured in prometheus.yml. Instead, Prometheus discovers all monitored hosts automatically via HTTP Service Discovery (http_sd_config) pointing to the Monitor application — the same application that manages the list of monitored SBC/CCM endpoints.
How it works
- The Monitor application maintains a registry of all monitored physical hosts — this is the single source of truth.
- Prometheus is configured to poll the Monitor's service-discovery endpoint on a regular interval (e.g., every 30 seconds).
- The Monitor returns the list of hosts running
node-exportersidecars along with their scrape targets. - Prometheus auto-configures scrape jobs for each discovered host — no
prometheus.ymlchanges needed.
When a new physical host is added as a monitored node in the Monitor app, its node-exporter endpoint is automatically discovered. When it's removed, the scrape target is cleaned up automatically.
Targets for scraping are managed in the Monitor application's Prometheus Devices interface (configured per monitored SBC/CCM node). See the section below for how to add, discover, and manage endpoints in the UI.
Prometheus configuration
The prometheus.yml file bundled with the server deployment uses HTTP service discovery to query the Monitor:
global:
  scrape_interval: 15s
  evaluation_interval: 15s

scrape_configs:
  # Discover all monitored hosts (including node-exporter targets) via the Monitor
  - job_name: "monitored-hosts"
    http_sd_configs:
      - url: "http://server:5000/api/prometheus/targets"
        refresh_interval: 30s
The Monitor application is responsible for:
- Maintaining the list of monitored hosts
- Returning node-exporter scrape targets for each host
- Providing labels (host-name, env, region, etc.) for Prometheus metric correlation
Deployment reference
For a detailed reference configuration, see the Prometheus configuration file that is included with the server deployment. The prometheus service definition in the Docker Compose files mounts this configuration into the Prometheus container.
UI: Managing Prometheus Devices
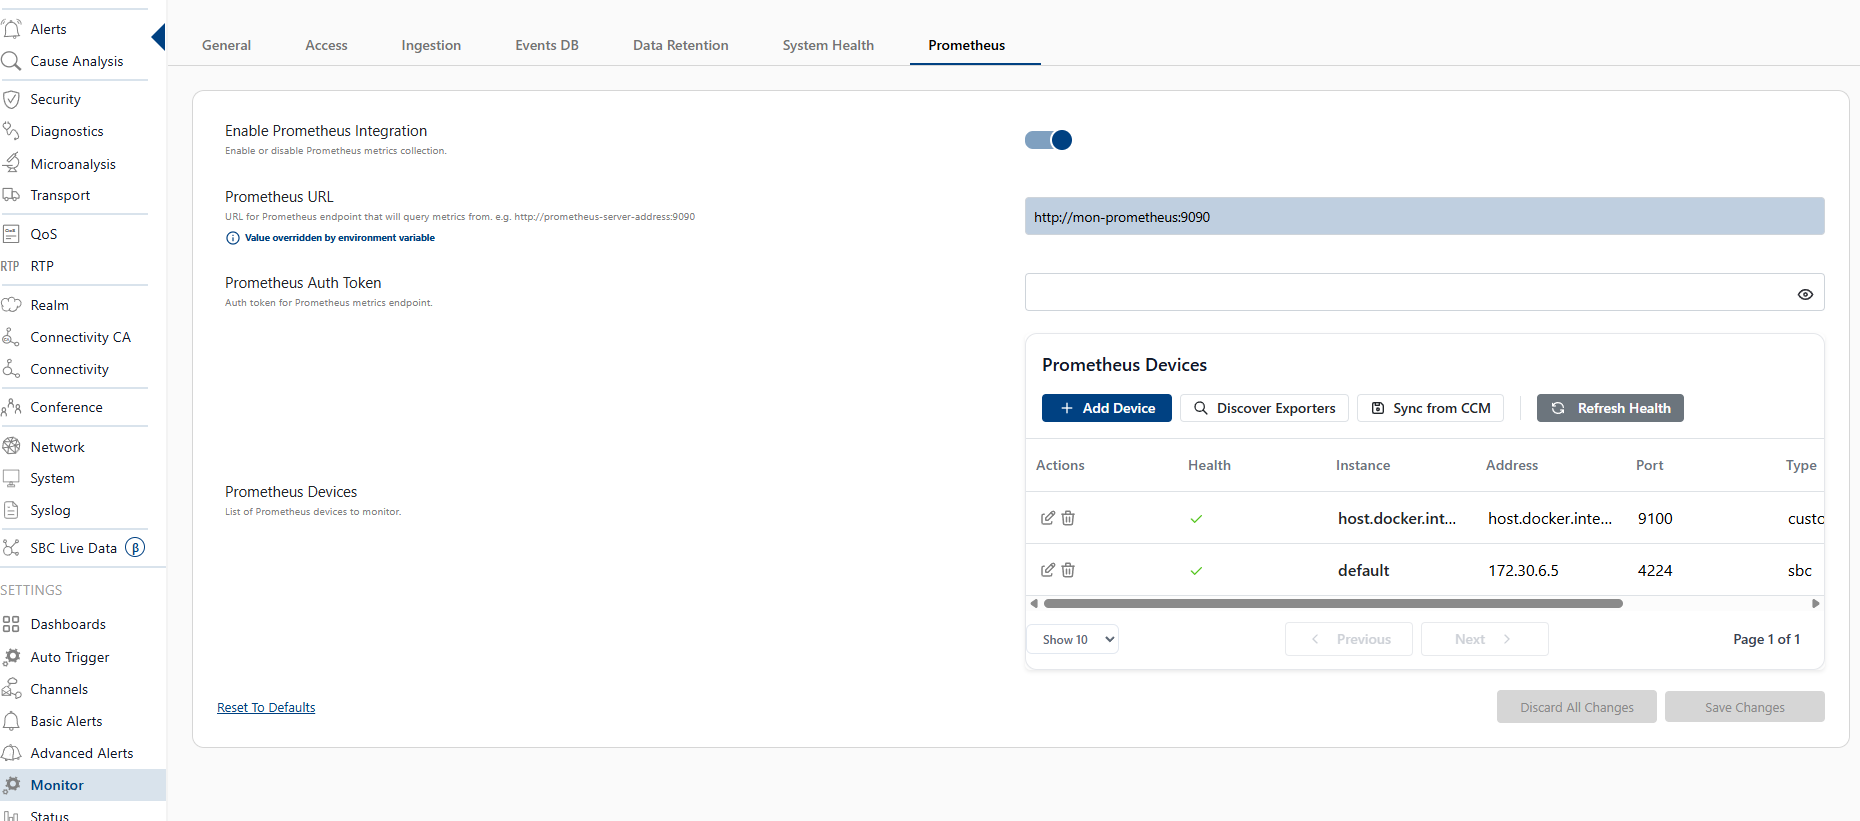
The Monitor application provides a built-in interface for managing Prometheus scrape targets — known as Prometheus Devices. This is where you add, discover, edit, disable, and delete the endpoints Prometheus should scrape for metrics.
What the UI shows
The device table displays the following columns:
| Column | Description |
|---|---|
| Instance | Human-readable name for the device (e.g. sbc-01, ccm-prod) |
| Address | IP or hostname of the exporter |
| Port | Port where the exporter serves metrics (default 9100 for node-exporter) |
| Type | SBC, CCM, Host, or Custom |
| Health | Real-time scrape health: green checkmark (healthy), red X (unhealthy), yellow (error), or grey (unknown/inactive) |
| Source | Badge indicating how the device was added: • 🟢 Auto-discovered — detected by running "Discover Exporters" or imported via "Sync from CCM" • 🔵 Manual — added directly by the user |
Filter dropdowns
Two filter dropdowns above the table let you narrow the view:
- Type filter:
All/SBC/CCM/Host/Custom - Source filter:
All/Auto-discovered/Manual
Health indicators
The Health column uses color-coded badges:
| Icon | Meaning | Condition |
|---|---|---|
| Green checkmark | Healthy | Last scrape returned 200 OK |
| Red X | Unhealthy | Last scrape failed or returned errors |
| Yellow warning | Error | Connection error (timeout, DNS failure) |
| Grey inactive | Inactive / Disabled | Device is disabled (enabled: false) or health has not been checked yet |
The "Refresh Health" button in the toolbar re-queries all endpoints and updates these statuses.
What users can do
Add Device
Click "Add Device" to open a modal form with the following fields:
| Field | Example | Description |
|---|---|---|
| Instance | sbc-01 | Unique display name (required) |
| Address | 10.0.0.42 | IP address or hostname of the exporter (required) |
| Port | 9100 | Metrics endpoint port (default: 9100) |
| Metric Path | /metrics | URL path to scrape (default: /metrics) |
| Schema | http or https | Protocol used by the exporter |
| Type | host | sbc, ccm, host, or custom |
| Scrape Interval | 15 | How often Prometheus should scrape (seconds) |
| Timeout | 5 | Scrape timeout in seconds |
| Retries | 3 | Number of retries on scrape failure |
| Labels | {} as JSON | Custom Prometheus labels attached to the target |
| Enabled | true | Whether this device is actively scraped |
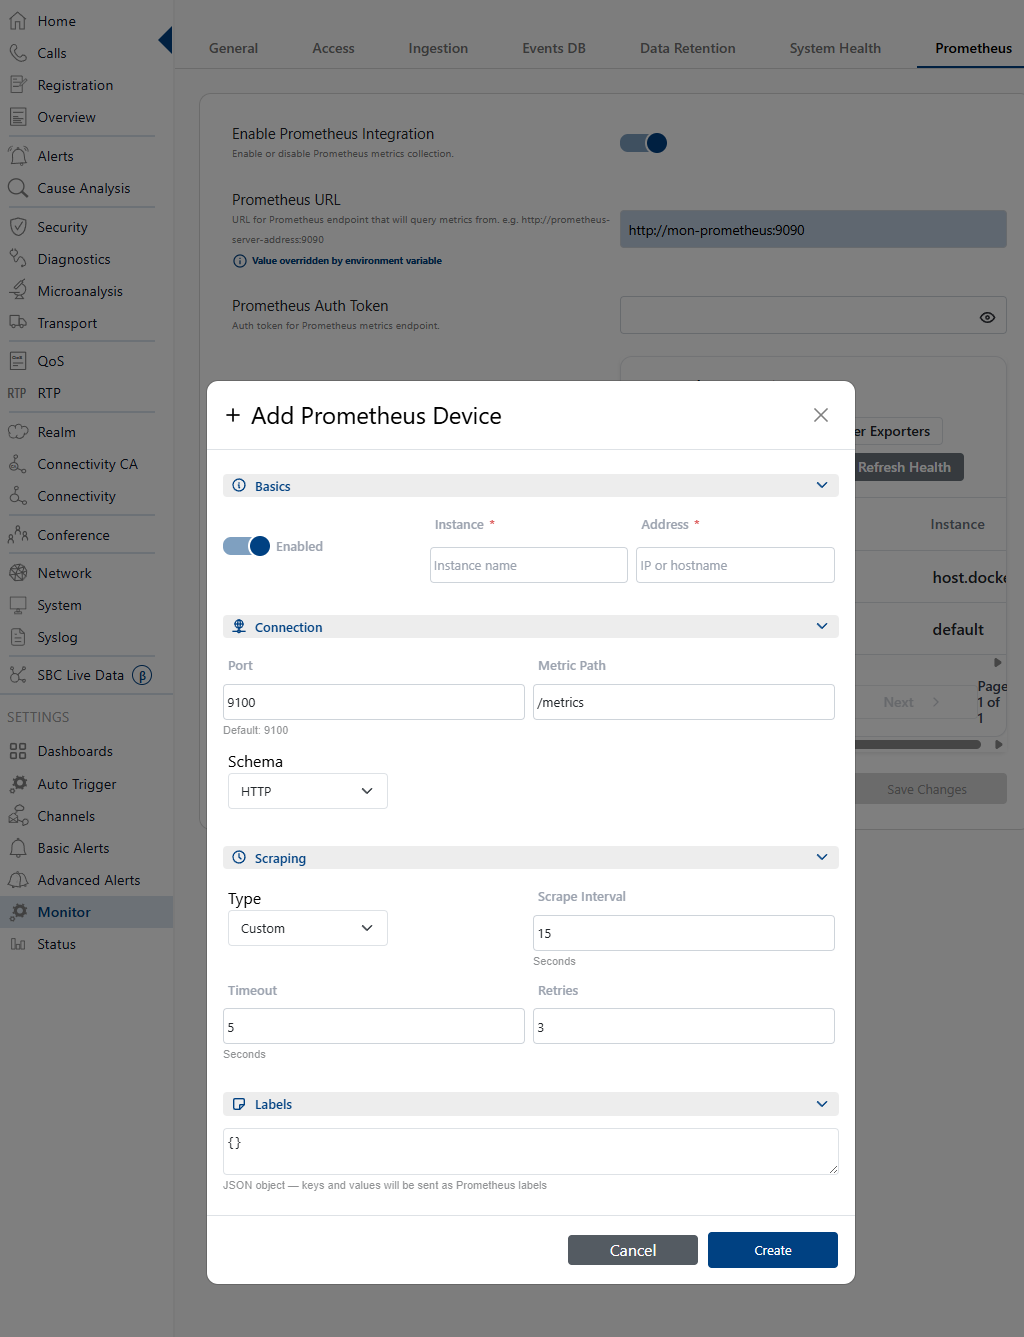
Notes:
- The upsert logic ensures that devices with the same
address:port:metricPathidentity are updated rather than duplicated. - Labels are passed through as Prometheus target labels and can be used for metric selectors (e.g.
{type="sbc", job="node"}).
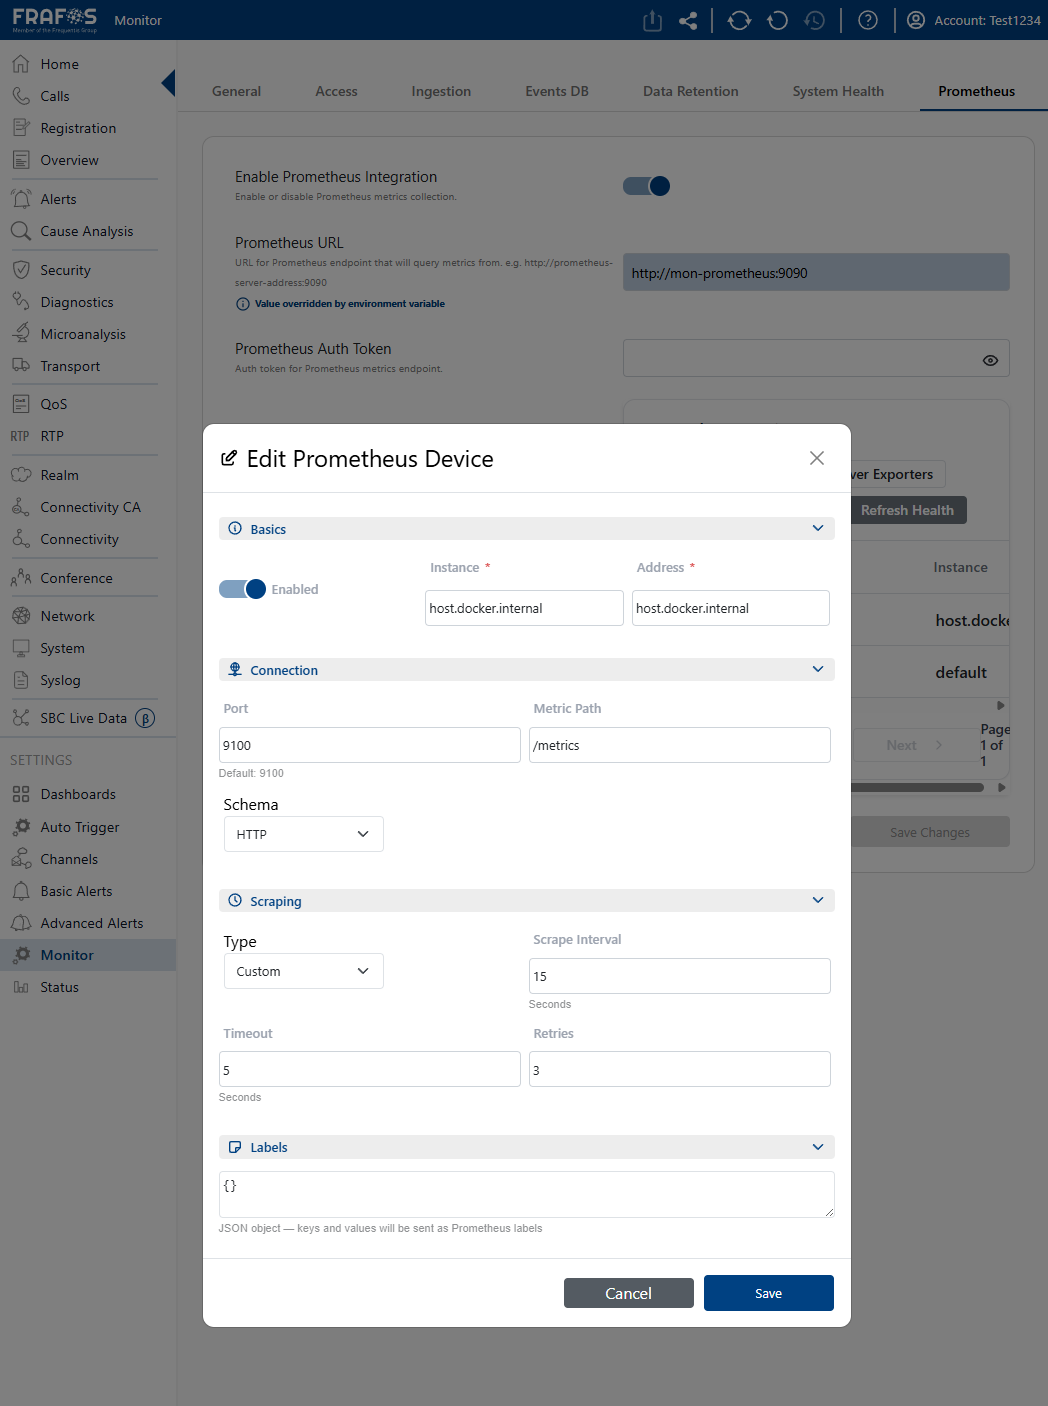
Edit Device
Click the pencil (edit) icon on any row to open the edit modal. All fields from the Add Device form are available. Changes are applied immediately to the device registry and take effect at the next Prometheus service-discovery poll (approximately every 30 seconds).
Delete Device
Click the trash icon on any row to delete the device. A confirmation dialog appears before deletion proceeds.
Important: Auto-discovered devices (discovery source = "auto-discovered") can now be deleted just like manually-added devices. Deletion removes the device from the registry entirely, not just from being scraped.
Disable / Enable
To temporarily stop scraping a device without removing it, set enabled: false in the edit modal. While disabled:
- The device remains in the registry
- Prometheus will exclude it from scrape targets (at the next
http_sdrefresh) - The Health column shows a grey inactive badge
- Re-enabling restores scraping immediately
Discover Exporters
Click "Discover Exporters" to automatically scan for Prometheus-compatible exporters on known SBC/CCM host addresses. The discovery process:
- Probes standard exporter ports (
9100,9101,9105,9222) on each known SBC host IP - Verifies each port by making an HTTP health check
- Creates device entries for any living endpoints with
discoverySource: "auto-discovered" - Updates existing auto-discovered devices if their health has changed
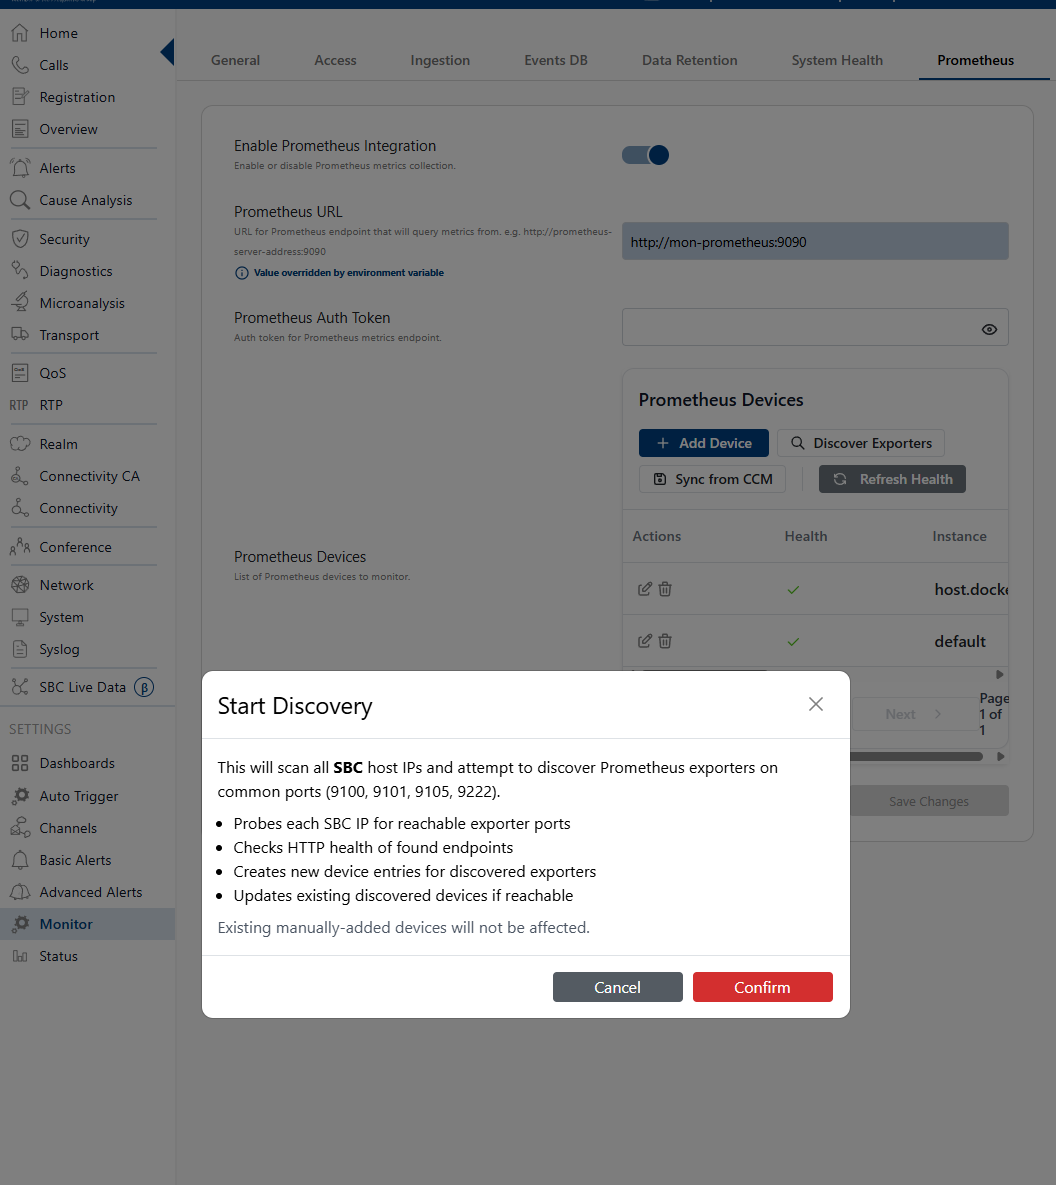
The confirmation dialog displays a summary before scanning begins. After discovery completes, the device list updates automatically and you'll see green "Auto-discovered" badges on newly found endpoints.
Sync from CCM
Click "Sync from CCM" to import SBC devices from the CCM (Central Control Manager) system. This action:
- Authenticates to the CCM using the current session cookie
- Fetches the configured SBC inventory
- Upserts each SBC as a Prometheus device entry (type =
ccm)
The sync creates new entries or updates existing ones — it never deletes devices that already exist but were not returned by the CCM.
How devices become Prometheus targets
Each device in the table maps to one Prometheus scrape target. The Monitor application exposes a service-discovery endpoint (GET /api/prometheus/ListTargets) that Prometheus queries on a schedule (default every 30 seconds). The response is a JSON list of target groups in the standard http_sd_config format:
[
  {
    "targets": ["10.0.0.42:9100"],
    "labels": {
      "__scheme__": "http",
      "__metrics_path__": "/metrics",
      "instance": "sbc-01",
      "type": "node_exporter"
    }
  }
]
Only devices that are enabled: true are included in the targets list. When a device is disabled, it is automatically excluded at the next scrape cycle.
Troubleshooting
Issues with the sidecar are covered in the Node Exporter Sidecar Troubleshooting guide.