Home Dashboard
Welcome to the Monitor Home Dashboard! This page provides a quick overview of key metrics and features. Explore the tabs and notes below for more details.
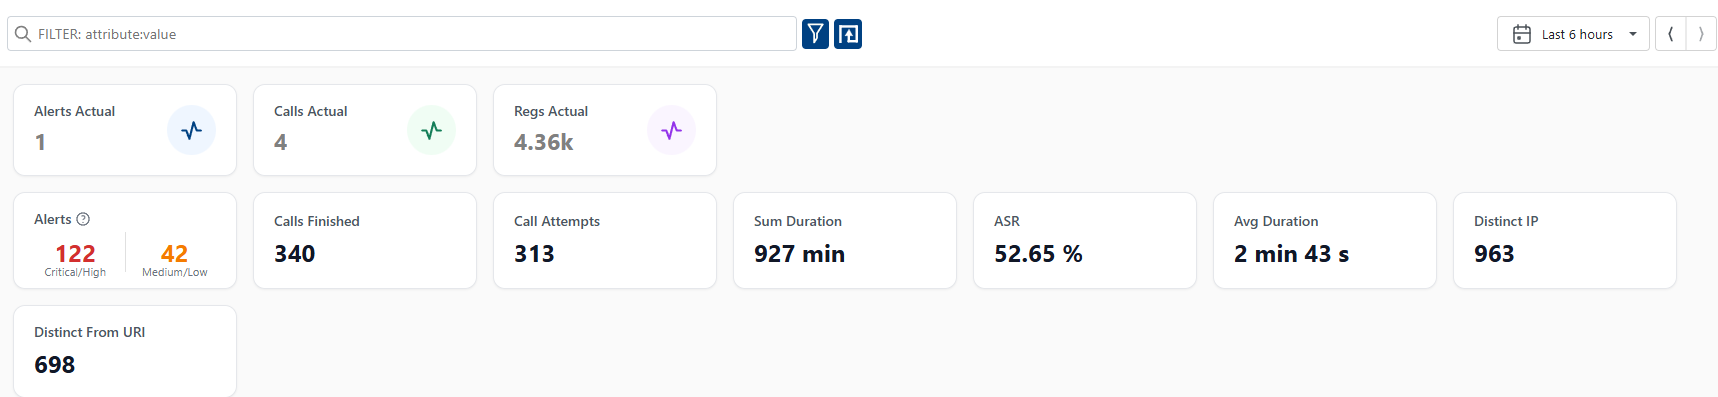
Main Cards Overview:
- ALERTS ACTUAL: Number of currently active alerts in the system.
- CALLS ACTUAL: Number of ongoing (active) VoIP calls.
- REGS ACTUAL: Number of currently registered SIP endpoints.
- ALERTS: Total number of alerts (including historical or resolved).
- CALLS FINISHED: Number of calls that have completed.
- CALL ATTEMPTS: Total number of call attempts (successful or not).
- SUM DURATION: Cumulative duration of all finished calls.
- ASR: Answer-Seizure Ratio, the percentage of successfully connected calls out of all attempts.
- AVG DURATION: Average duration of completed calls.
- DISTINCT IP: Number of unique IP addresses seen in call or registration events.
- DISTINCT FROM URI: Number of unique SIP From URIs observed.
- Parallel Calls
- Parallel Regs
- Alerts
- CA Availability
- Type Date Heatmap
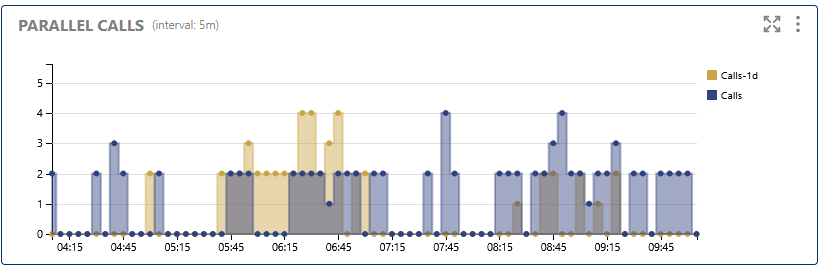
This section displays the current number of concurrent VoIP calls being handled by the system. Monitoring parallel calls helps you understand peak usage times and overall call traffic.
This section shows the number of concurrent calls in real time.
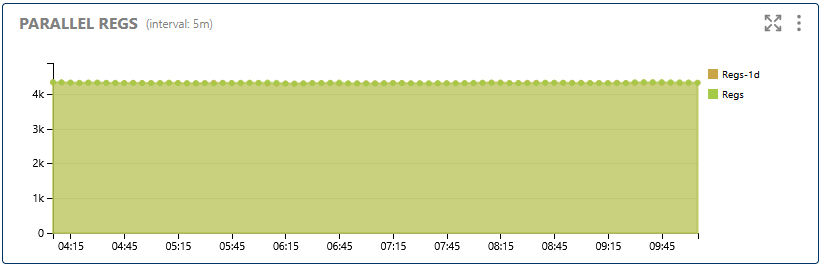
Here you can see the number of active SIP registrations. This metric reflects how many endpoints (phones, softphones, gateways) are currently registered and ready to make or receive VoIP calls.
Track the number of simultaneous SIP registrations.
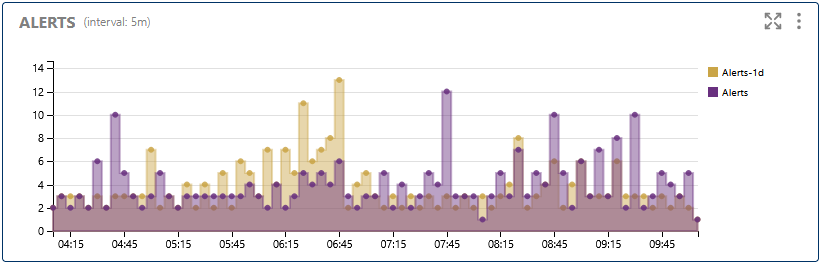
The Alerts section provides a summary of current system warnings, errors, or unusual events detected in your VoIP infrastructure. Use this to quickly identify and respond to issues affecting call quality or availability.
Stay alert! This section lists current system warnings and errors.
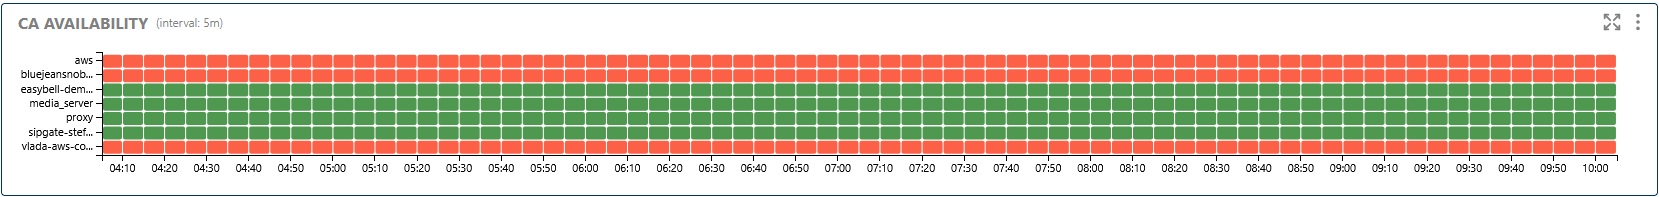
This section shows the availability status of Certificate Authorities (CAs) used for secure VoIP signaling and media. Ensuring CA availability is crucial for encrypted communications and secure device authentication.
Check the availability status of your Certificate Authorities.
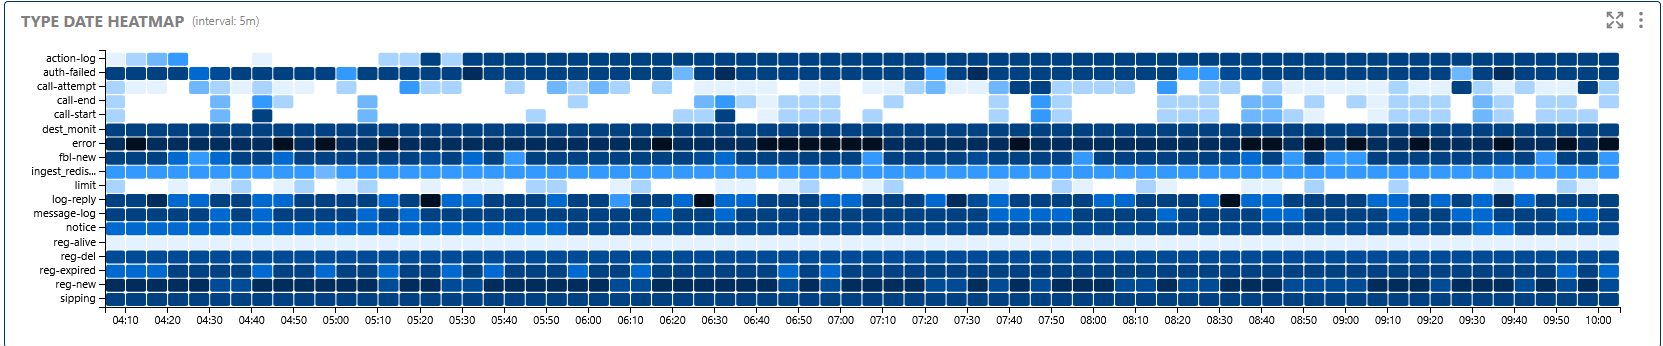
The Type Date Heatmap visualizes VoIP activity trends over time, such as call volume, registration spikes, or alert frequency. Use this to spot patterns, anomalies, or busy periods in your VoIP network.
Visualize activity trends over time with the interactive heatmap.