Microanalysis Dashboard
Welcome to the Microanalysis Dashboard! This page provides deep insights into call/session details, protocol usage, and network behavior. Use the tabs below to explore each metric in detail.
- Top 10 Types Count
- From UA
- SIP Method
- SIP-Code
- Top Subnets
- Agent Versions
- r-URI - Short
- Events by IP Addr
- SRC CA ID
- Originator
- Top 10 From
- Caller Domain
- Top 10 To
- Distinct Destinations
- Top Call Attempts
- Top Call Ends
- Destination by R-URI
- Signature
- Sum Duration
- Duration Group
- Top Duration
- Top Duration < 5 sec
- Top SBCs List
- Top Hosts List
- Calling Countries
- SBC Versions
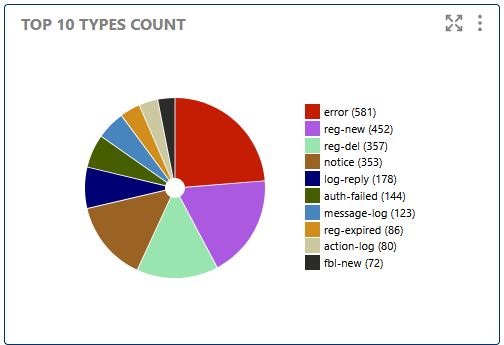
This section displays the most frequent event types, helping you quickly identify dominant call/session activities and spot unusual patterns in protocol usage.
Shows the most frequent event types, helping you identify dominant call/session activities.
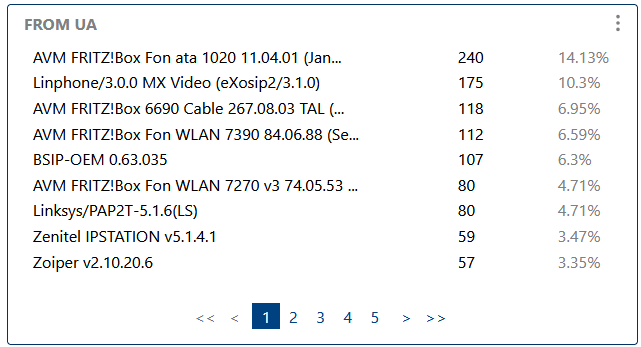
Here you can see the most common SIP User-Agents (phones, softphones, apps) involved in your traffic. This is useful for device inventory, firmware tracking, and detecting unknown or suspicious devices.
Lists the most common SIP User-Agents, useful for device inventory and anomaly detection.

This visualization shows the distribution of SIP methods (INVITE, BYE, REGISTER, etc.), providing insight into signaling patterns, call flows, and protocol usage.
Visualizes the distribution of SIP methods (INVITE, BYE, REGISTER, etc.) to understand signaling patterns.

This section breaks down events by SIP response code, aiding in troubleshooting and identifying common failure reasons such as busy signals, call rejections, or network errors.
Breaks down events by SIP response code, aiding in troubleshooting and identifying common failure reasons.
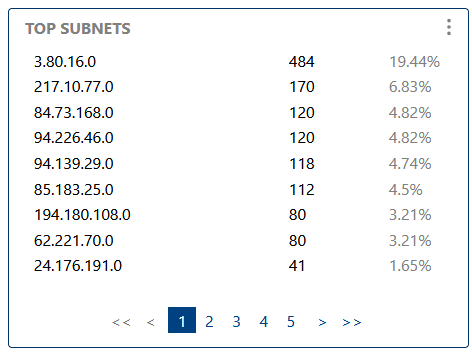
Highlights subnets with the most activity, helping you spot network hotspots, load distribution, or potential attack sources.
Highlights subnets with the most activity, helping you spot network hotspots or issues.

Shows the distribution of agent versions in your network, useful for tracking upgrades, compatibility, and identifying outdated or vulnerable software.
Shows the distribution of agent versions, useful for tracking upgrades and compatibility.
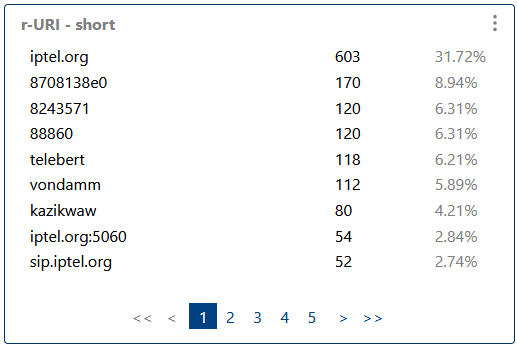
Lists the most common Request-URIs, helping to analyze routing, destination patterns, and detect misrouted or suspicious traffic.
Lists the most common Request-URIs, helping to analyze routing and destination patterns.
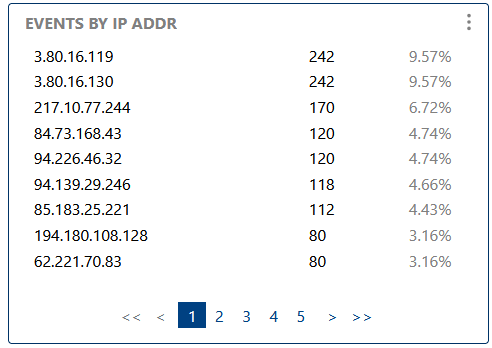
Breaks down events by originating IP address, useful for tracking network activity, identifying suspicious sources, and correlating with security events.
Breaks down events by originating IP address, useful for tracking network activity and identifying suspicious sources.

Shows the distribution of source Call-Agent IDs, helping to monitor system usage, load balancing, and detect misconfigured or rogue agents.
Shows the distribution of source Call-Agent IDs, helping to monitor system usage and load.
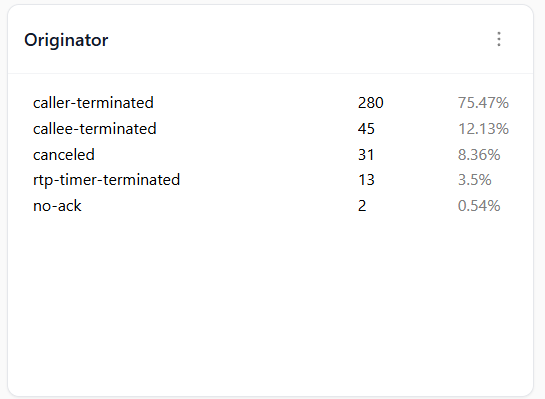
Identifies the main originators of calls or events, aiding in root cause analysis, fraud detection, and usage monitoring.
Identifies the main originators of calls or events, aiding in root cause analysis.
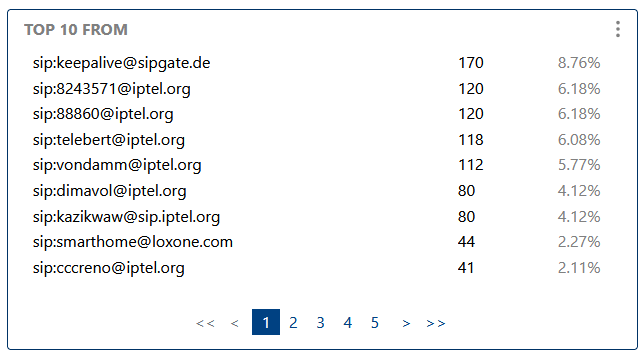
Highlights the most frequent calling parties, useful for detecting high-activity users, potential abusers, or key customers.
Highlights the most frequent calling parties, useful for detecting high-activity users.
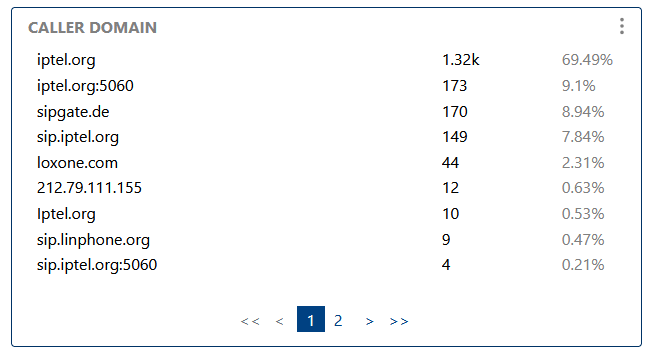
Shows the distribution of caller domains, helping to monitor multi-tenant or hosted environments, and spot domain-based anomalies.
Shows the distribution of caller domains, helping to monitor multi-tenant or hosted environments.
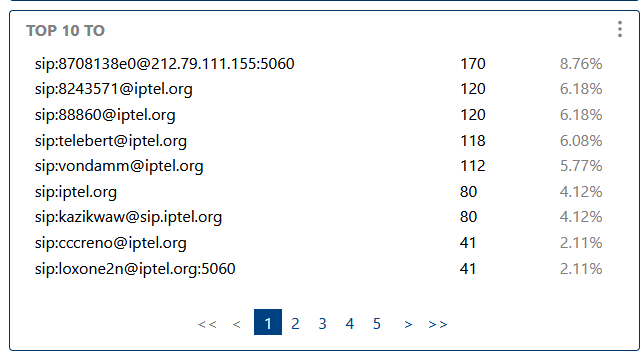
Highlights the most frequent called parties, useful for detecting popular destinations, service abuse, or business trends.
Highlights the most frequent called parties, useful for detecting popular destinations.
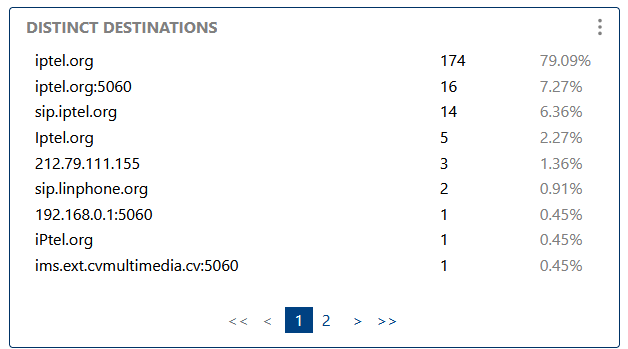
Shows the number of unique destinations, helping to assess network diversity, detect scanning, or spot new endpoints.
Shows the number of unique destinations, helping to assess network diversity.
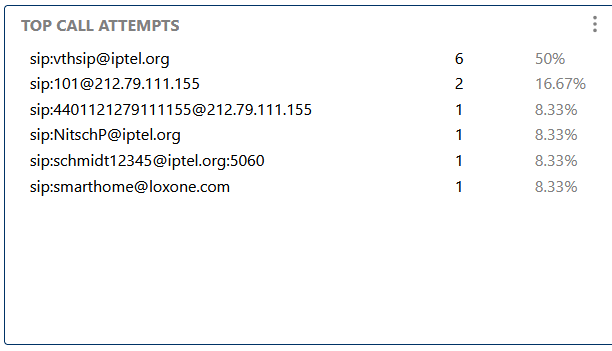
Lists the sources with the most call attempts, useful for fraud detection, capacity planning, and identifying aggressive dialers.
Lists the sources with the most call attempts, useful for fraud detection and capacity planning.
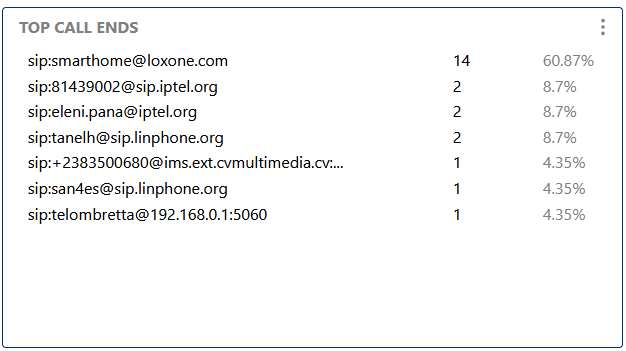
Shows the sources with the most call terminations, helping to spot abnormal disconnect patterns, dropped calls, or problematic endpoints.
Shows the sources with the most call terminations, helping to spot abnormal disconnect patterns.
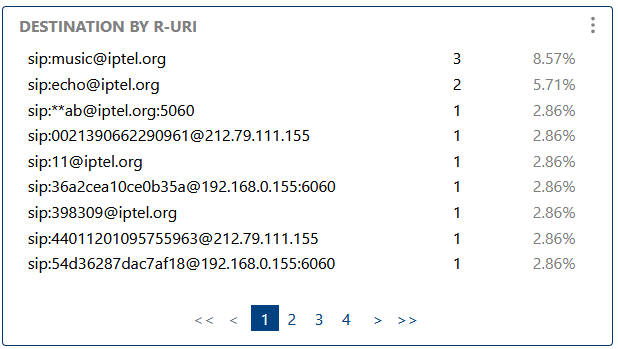
Maps destinations by Request-URI, aiding in routing analysis, troubleshooting, and understanding call flows.
Maps destinations by Request-URI, aiding in routing analysis.

Displays event or call signatures for advanced troubleshooting, pattern recognition, and forensic analysis.
Displays event or call signatures for advanced troubleshooting and pattern recognition.
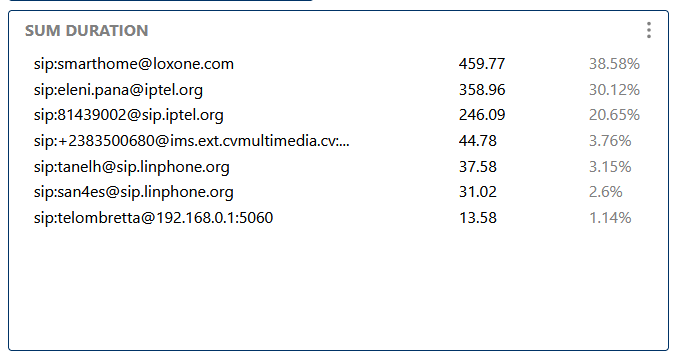
Shows the total duration of all calls, useful for usage analysis, billing, and capacity planning.
Shows the total duration of all calls, useful for usage analysis and billing.

Groups calls by duration ranges to analyze call length patterns, detect outliers, and optimize resource allocation.
Groups calls by duration ranges to analyze call length patterns.
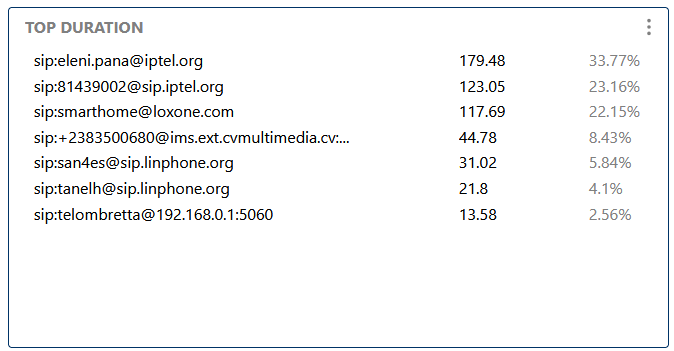
Highlights the longest calls, helping to spot outliers, abnormal sessions, or potential fraud.
Highlights the longest calls, helping to spot outliers or abnormal sessions.

Shows the most frequent very short calls, useful for detecting failed, spam, or test calls.
Shows the most frequent very short calls, useful for detecting failed or spam calls.

Lists the most active Session Border Controllers, helping to monitor infrastructure load, redundancy, and failover.
Lists the most active Session Border Controllers, helping to monitor infrastructure load.

Shows the most active hosts in the network, aiding in resource planning, anomaly detection, and capacity management.
Shows the most active hosts in the network, aiding in resource planning and anomaly detection.
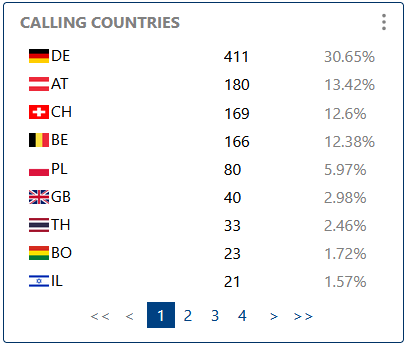
Visualizes the distribution of call origins and destinations by country, helping to monitor international activity, compliance, and detect unusual patterns.
Visualizes the distribution of call origins and destinations by country.

Shows the distribution of SBC software versions, useful for upgrade planning, compatibility checks, and identifying outdated systems.
Shows the distribution of SBC software versions, useful for upgrade planning and compatibility checks.