Status Dashboard
Stay up-to-date with the health and performance of your system using the Status Dashboard. This dashboard provides real-time notifications and key metrics for CPU, memory, disk, Vector, events, peak calls, and Elasticsearch indices.
- Notifications
- CPU
- Memory
- Disk
- Vector
- Peak Calls
- Elasticsearch
- Indices Stats
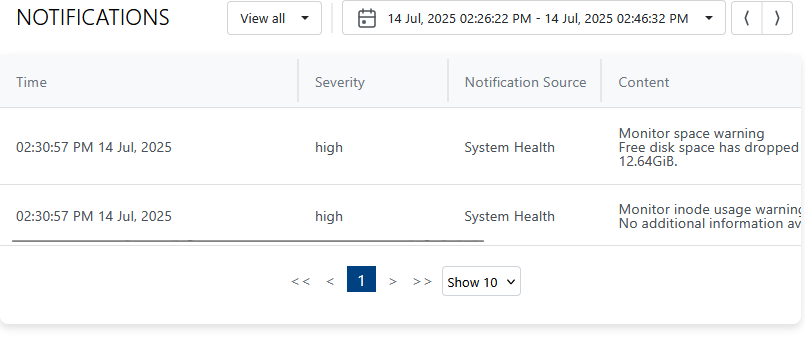
Displays system notifications and alerts, helping you stay informed about important events and issues.
Review notifications regularly to catch problems early.
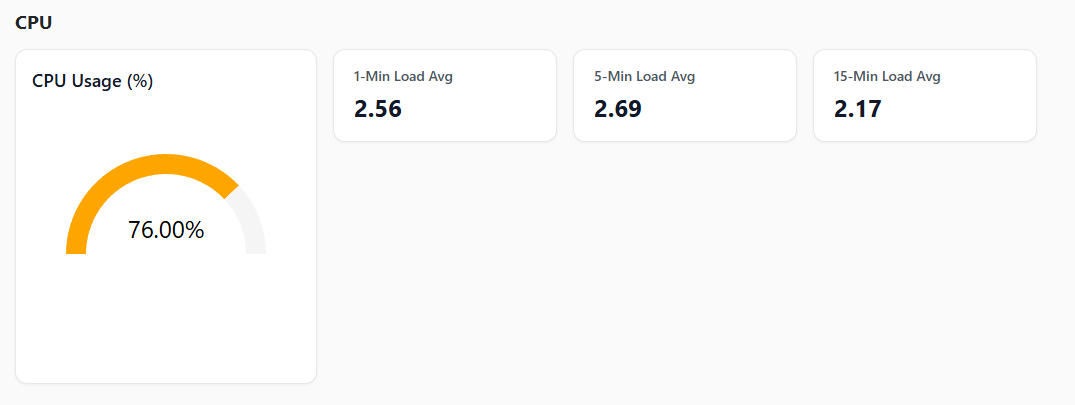
Shows current CPU usage and trends, allowing you to monitor processing load.
High CPU usage may indicate heavy workloads or performance bottlenecks.

Displays memory usage statistics, helping you track available and used memory.
Low available memory can lead to degraded performance or crashes.
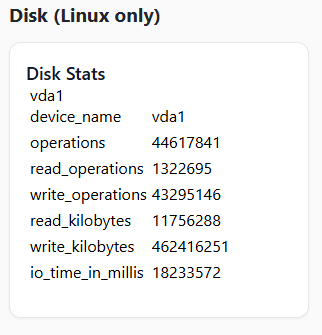
Shows disk usage and free space, important for maintaining system stability.
Monitor disk space to prevent storage-related outages.
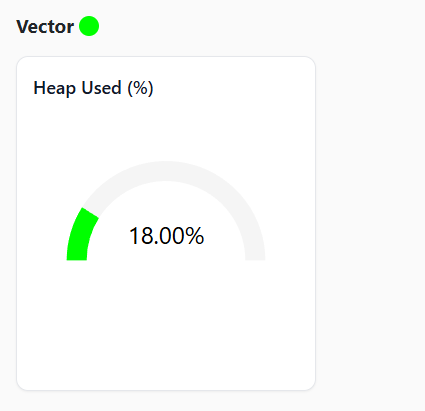
Provides status and metrics for Vector, your log processing pipeline.
Check Vector health to ensure logs are being processed correctly.
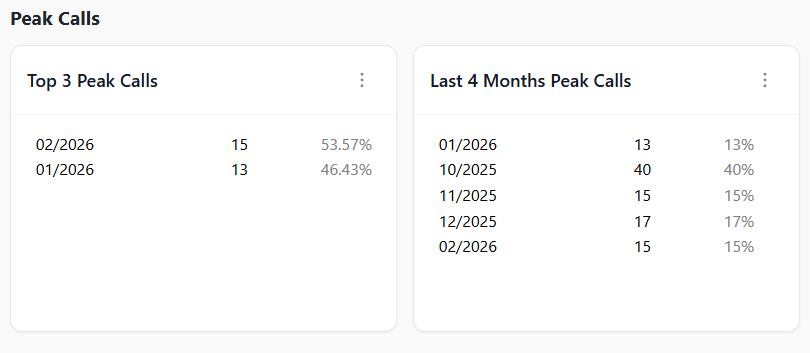
Shows the highest number of concurrent calls observed, useful for capacity planning.
Use this to track system limits and plan for scaling.
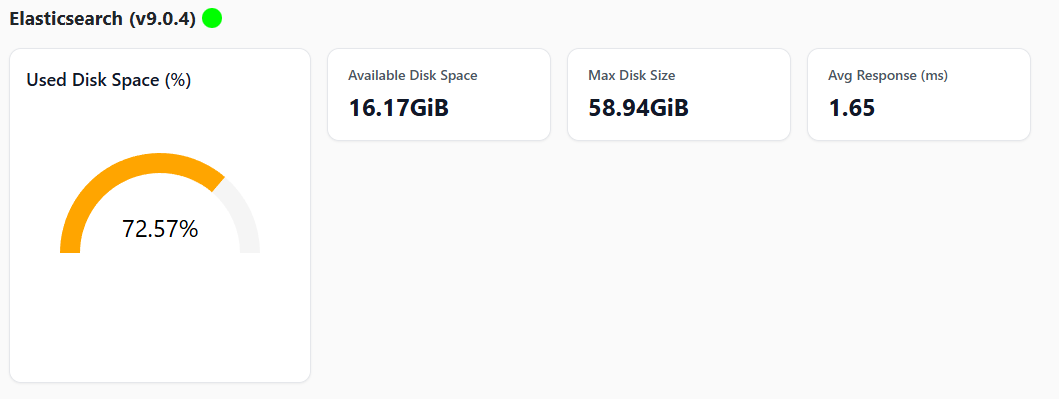
Provides an overview of Elasticsearch health and status.
Monitor Elasticsearch to ensure search and analytics are functioning properly.
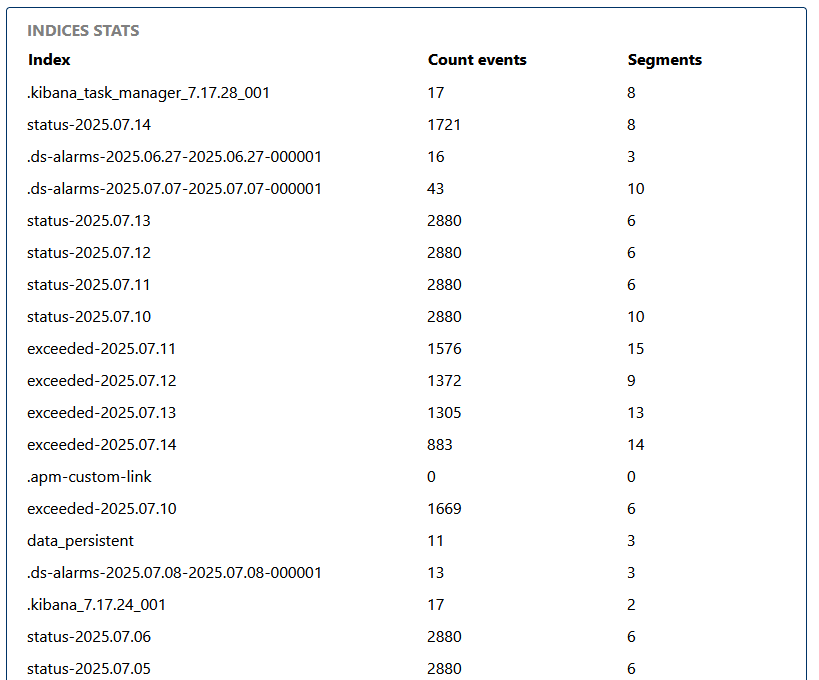
Displays detailed statistics for Elasticsearch indices, such as size, document count, and health.
Use indices stats to optimize search performance and storage.