Advanced Alerts: Overview & Visual Guide
This page introduces the Advanced Alerts dashboard — a real-time anomaly detection and automation system for SIP/VoIP environments. It covers all four dashboard sections, how they relate to each other, and how to navigate the interface.
Dashboard Layout
The Advanced Alerts dashboard is composed of four sections:
| Section | Purpose |
|---|---|
| Event Transformation Function | Pre-processes every incoming event with custom JavaScript before alert evaluation |
| Global Variables | Stores shared config values and configures ingestion & RESTful notification plugins |
| Alert Config | Defines the alert rules — conditions, keys, thresholds, severity, and notification targets |
| Timeseries & Bookmarks | Visualizes time series data for individual alert keys and saved bookmarks |
Event Transformation Function
The Event Transformation Function is a JavaScript function that is executed on every incoming event before it reaches alert processing. Use it to enrich, normalize, or modify events so they can be evaluated correctly by your alert rules.
If the transformation function fails, the incoming event will be considered in undefined status and will NOT be processed.
Transformation Function Signature
The function receives two arguments:
function myTransform(event, vars) {
  // event: the incoming JSON event object — modify it directly
  // vars:  object containing all current Basic Global Variables as key/value pairs
}
It takes the event as a parameter and has the freedom to modify it.
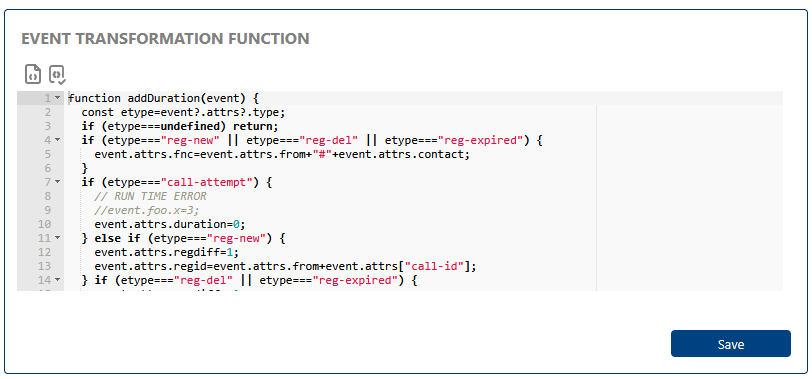
Example Transformation Function
This example handles several common SIP event types:
function addDuration(event) {
  const etype = event?.attrs?.type;
  if (etype === undefined) return;
  if (etype === "reg-new" || etype === "reg-del" || etype === "reg-expired") {
    event.attrs.fnc = event.attrs.from + "#" + event.attrs.contact;
  }

  if (etype === "call-attempt") {
    // Example: set duration to 0 for call attempts
    event.attrs.duration = 0;
  } else if (etype === "reg-new") {
    event.attrs.regdiff = 1;
    event.attrs.regid = event.attrs.from + event.attrs["call-id"];
  }
  if (etype === "reg-del" || etype === "reg-expired") {
    event.attrs.regdiff = -1;
    event.attrs.regid = event.attrs.from + event.attrs["call-id"];
  }
  // Normalize index name by removing date
  if (event?.metadataAA) {
    event.metadataAA.fullIndex = event?.metadataAA?.index?.split("-")?.[0];
  }
}
Use the Test Event button to run a sample JSON event through your transformation function and see the result before saving.
Toolbar Actions
| Button | Action |
|---|---|
| Test Event | Opens the Test Event modal — paste a JSON event and preview the transformation output |
| Save | Validates and saves the function. Clears the function if the editor is empty (removes transformation entirely) |
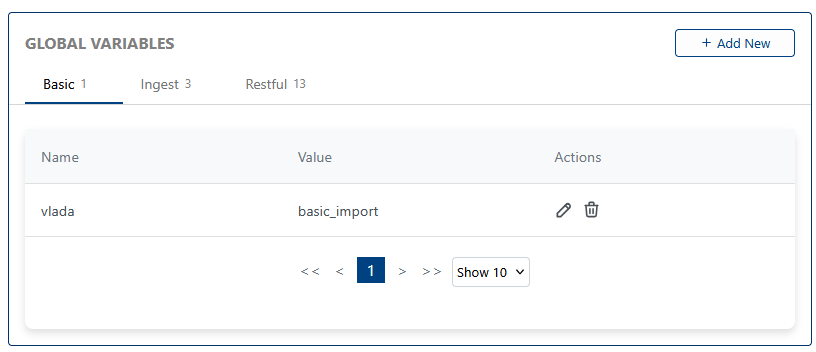
Global Variables
Global Variables are named, typed configuration values shared across the alert system. They are organized into three tabs based on their purpose: Basic, Ingest, and Restful.
Quick summary:
- Basic — Reusable values (strings, numbers, IPs, expressions) passed to the transformation function as the
varsargument, and usable in alert configurations - Ingest — Configure data source plugins that feed events into the system (e.g. SIP health polling, HTTP polling)
- Restful — Configure notification destinations (Slack, OpsGenie, PagerDuty, generic webhook). These populate the Restful Channel dropdown when creating or editing alerts
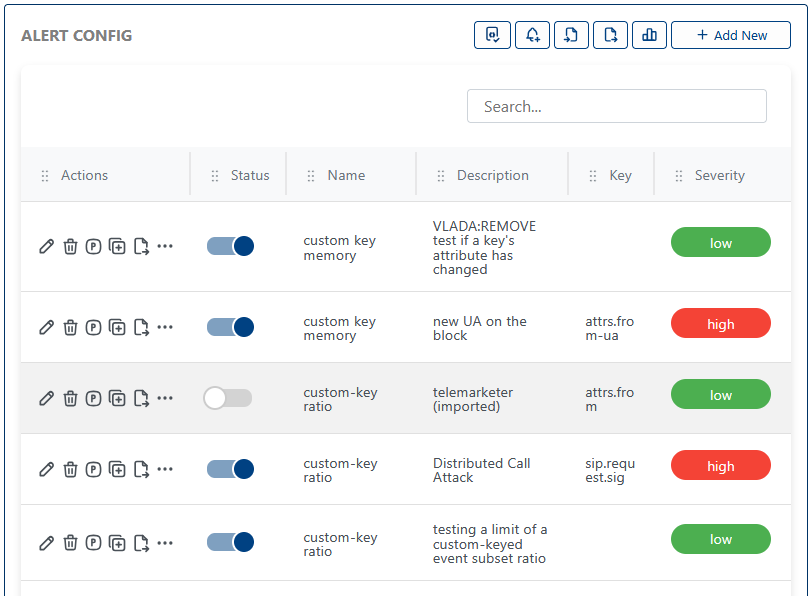
Alert Config
The Alert Config section is where you define, manage, and monitor your alert rules. Each alert specifies what to watch, how to evaluate it, and where to send notifications when it fires.
- Test Event
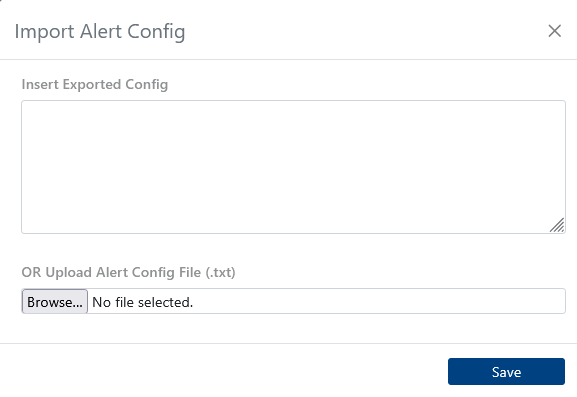
- Import Alert Config
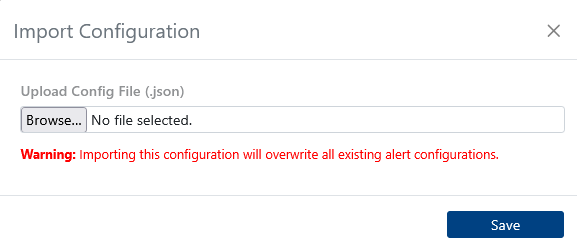
- Import Configuration
- Example Alert Config JSON
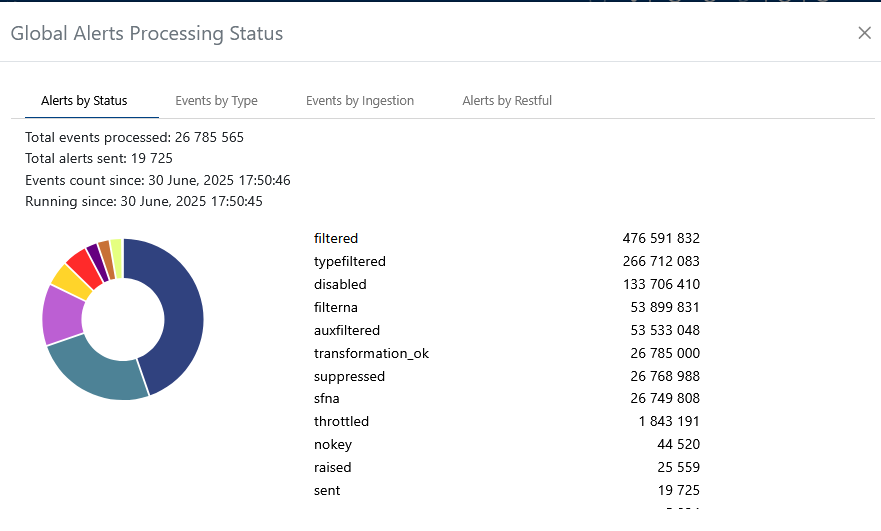
- Global Alert Processing
Preview how a test event is processed and triggers alerts. Useful for debugging and validation.

Import alert configurations from external sources to quickly set up or migrate alert rules.
Import system-wide configuration settings for alerts and notifications.
Download or review a sample alert configuration JSON file for reference or bulk import. Below is a snippet from the file:
{
  "ESvkpz_8": {
    "name": "custom key memory",
    "info": "See if an attribute is chaning in a keyed event stream",
    "type": "CKM",
    "enable": true,
    "description": "VLADA:REMOVE test if a key's attribute has changed",
    "parameters": {
      "filter": { "value": "" },
      "key": { "value": "" },
      "keyMask": { "value": "" },
      "ignore": { "value": 2 }
    }
  }
}
Visualize the global alert processing workflow and understand how events flow through the system.
Adding a New Alert
Adding a new alert is simple and intuitive. Use the interface below to define your alert criteria, actions, and notification preferences. The screenshots in the tabs illustrate different alert types and advanced options.
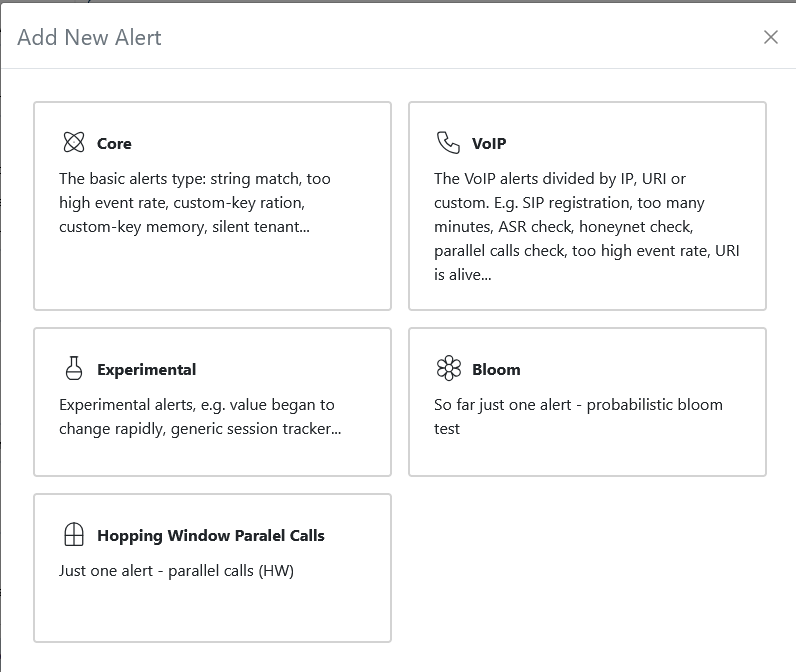
- Core Alert
- VoIP Alert
- Experimental Alert
- Bloom Alert
- Hopping Window Calls
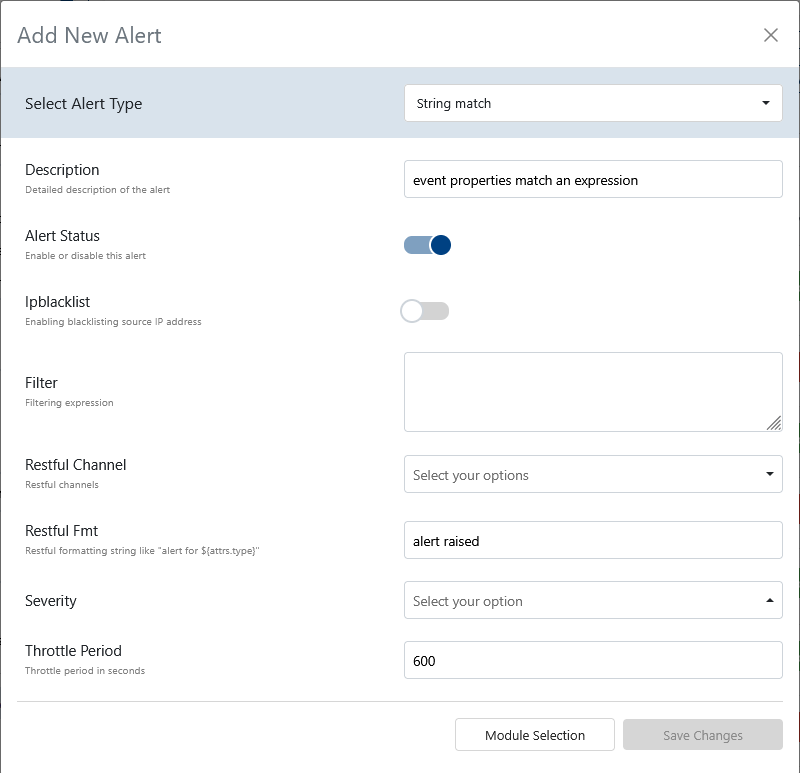
- Alert Type: Select from
string match,custom-key match,custom key memory,silent tenant,custom-key high rate, orcustom-key ratio. See Events Reference for event types. - Description: A human-readable explanation of what this alert does.
- Alert Status: Toggle to enable or disable the alert itself.
- IP BlackList: Toggle to enable or disable blacklisting of the source IP address when the alert triggers.
- Filter: Free-form text for a filtering expression to select relevant events.
- Restful Channel: Choose from a predefined list of RESTful notification channels.
- Restful FMT: Formatting string for RESTful notifications (e.g.,
alert for attrs.type). - Severity: Select the severity level:
high,medium,low, orinfo. - Throttle Period: Throttle period in seconds to limit alert frequency.
Adjust these fields to match your monitoring needs. For more on event attributes, see the Events Reference.
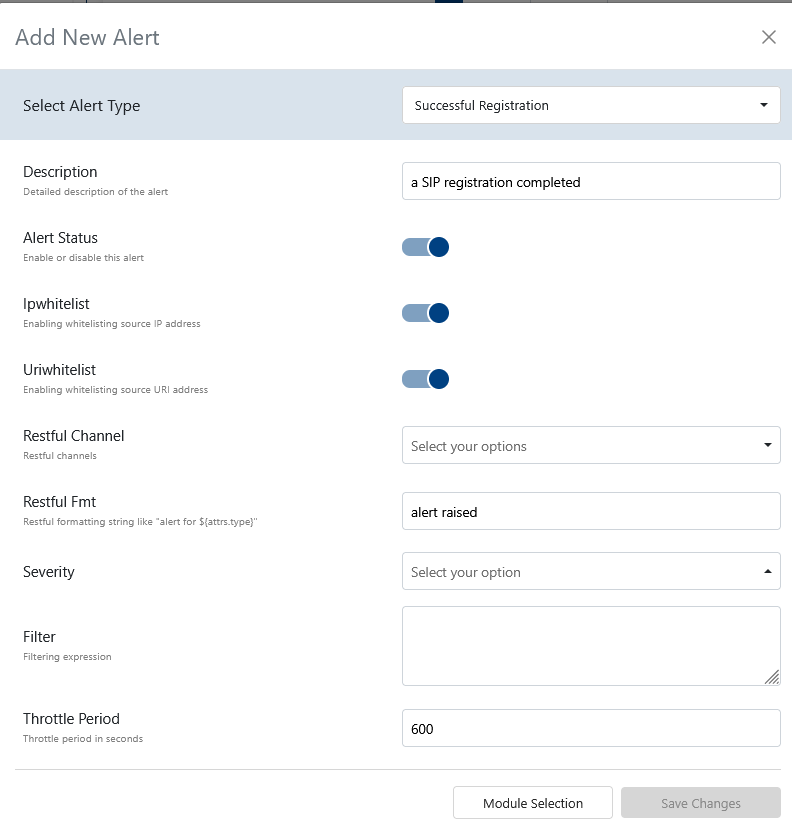
- Alert Type: Select from a comprehensive list, including
Successful Registration,Unknown User Agent,Unknown Subnet,Changed Country,Too many minutes from an IP,Too many minutes from a URI,Low Dst ASR,Low ASR,Honeynet,EvilUser Agent,Parallel Calls for a custom key,Parallel Calls for destination IP,Parallel Calls for URI,Parallel Calls for tenant,Late BYEs,Too Long Calls from an IP,Failing Authentications from a URI,Failing Authentications from an IP,URI many call attempts,IP many call attempts,URI custom ratio,Ratio,IP custom match ratio,From-URI high rate,Src/dst IP high rate,From/To URI high rate,To URI high rate,Uri Watch. See Events Reference for event types. - Description: A human-readable explanation of what this alert does.
- Alert Status: Toggle to enable or disable the alert itself.
- IP Whitelist: Toggle to enable whitelisting of source IP addresses.
- URI Whitelist: Toggle to enable whitelisting of source URI addresses.
- Restful Channel: Choose from a predefined list of RESTful notification channels.
- Restful FMT: Formatting string for RESTful notifications (e.g.,
alert for).${attrs.type} - Filter: Filtering expression to select relevant events.
- Severity: Select the severity level:
high,medium,low, orinfo. - Throttle Period: Throttle period in seconds to limit alert frequency.
Use these fields to monitor VoIP-specific issues. For event details, see the Events Reference.
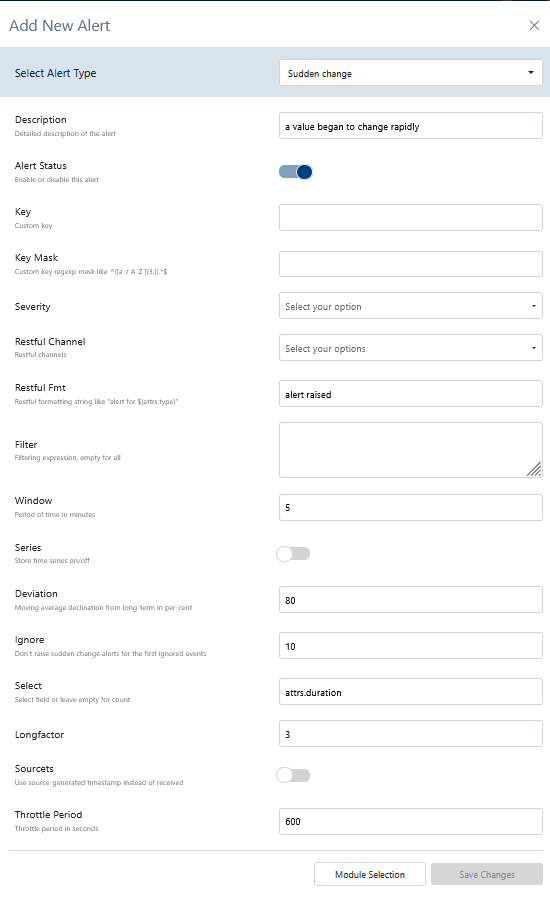
- Alert Type: Select from
sudden changes,parallel sessions for a custom key,value change, orz-score[1]. See Events Reference for event types. - Description: A human-readable explanation of what this alert does.
- Alert Status: Toggle to enable or disable the alert itself.
- Key: Custom key for grouping or identifying event streams.
- Key Mask: Custom key regexp mask (e.g.,
^([a-z A-Z ]{3,}).*$ - Severity: Select the severity level:
high,medium,low, orinfo. - Restful Channel: Choose from a predefined list of RESTful notification channels.
- Restful FMT: Formatting string for RESTful notifications (e.g.,
alert for).${attrs.type} - Filter: Filtering expression to select relevant events.
- Window: Period of time in minutes for the alert window.
- Series: Toggle to store time series data (on/off).
- Deviation: Moving average declination from long-term in percent.
- Ignore: Number of initial events to ignore before raising sudden change alerts.
- Select: Select field or leave empty for count.
- Longfactor: Long-term factor for moving average calculations.
- Sourcets: Toggle to use source-generated timestamp instead of received timestamp.
- Throttle Period: Throttle period in seconds to limit alert frequency.
Use experimental alerts to prototype new detection logic. Reference event types as needed.
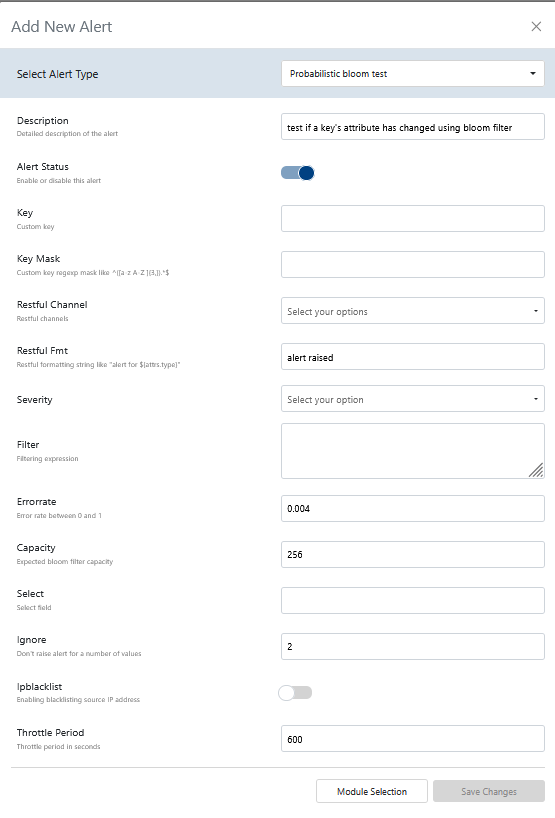
- Alert Type: Select from
probabilistic bloom test. See Events Reference for event types. - Description: A human-readable explanation of what this alert does.
- Alert Status: Toggle to enable or disable the alert itself.
- Key: Custom key for grouping or identifying event streams.
- Key Mask: Custom key regexp mask (e.g.,
^([a-z A-Z ]{3,}).*$ - Severity: Select the severity level:
high,medium,low, orinfo. - Restful Channel: Choose from a predefined list of RESTful notification channels.
- Restful FMT: Formatting string for RESTful notifications (e.g.,
alert for).${attrs.type} - Filter: Filtering expression to select relevant events.
- Errorrate: Error rate for the bloom filter (between 0 and 1).
- Capacity: Expected bloom filter capacity (number of unique items).
- Select: Select field or leave empty for count.
- Ignore: Number of values to ignore before raising an alert.
- IP Blacklist: Toggle to enable blacklisting of source IP address.
- Throttle Period: Throttle period in seconds to limit alert frequency.
Bloom alerts are for advanced, high-volume scenarios. See the Events Reference for event details.
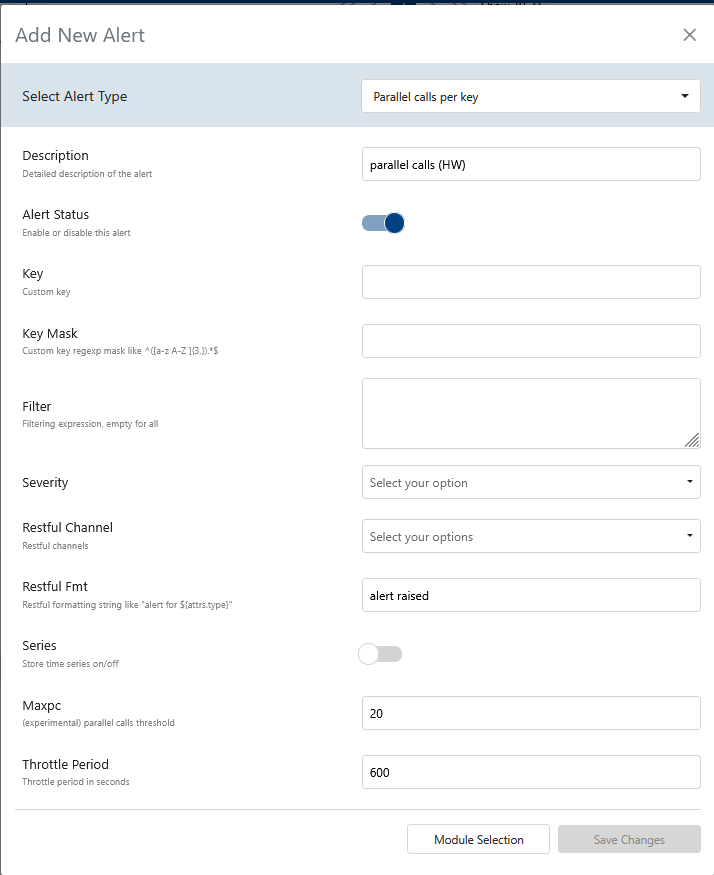
- Alert Type: Select from
parallel calls per key. See Events Reference for event types. - Description: A human-readable explanation of what this alert does.
- Alert Status: Toggle to enable or disable the alert itself.
- Key: Custom key for grouping or identifying event streams.
- Key Mask: Custom key regexp mask (e.g.,
^([a-z A-Z ]{3,}).*$ - Filter: Filtering expression to select relevant events.
- Severity: Select the severity level:
high,medium,low, orinfo. - Restful Channel: Choose from a predefined list of RESTful notification channels.
- Restful FMT: Formatting string for RESTful notifications (e.g.,
alert for).${attrs.type} - Series: Toggle to store time series data (on/off).
- maxpc: (Experimental) Parallel calls threshold.
- Throttle Period: Throttle period in seconds to limit alert frequency.
Use hopping window analytics to detect spikes in parallel calls. See the Events Reference for event details.
Configuration Import Size Limit
Large configuration imports may fail with a request entity too large error.
When importing an exported alerts configurations (via Import Configuration), the request may be rejected if the JSON payload exceeds the server's body size limit.
Cause:
Our Monitor server uses a default HTTP body size limit of 100 KB. Exported alert configurations with many alerts can easily exceed this.
Solution:
The server now applies a higher body size limit (5 MB) specifically for the advanced alerts API routes (/api/alertapi/*).
To check your export size before importing, look at the file size of the exported .json file. If it is larger than (5 MB) contact our support team.
TimeSeries & Bookmarks
The TimeSeries panel at the bottom of the dashboard visualizes historical data collected for individual alert keys. Bookmarks let you save and quickly return to a specific alert + key combination.
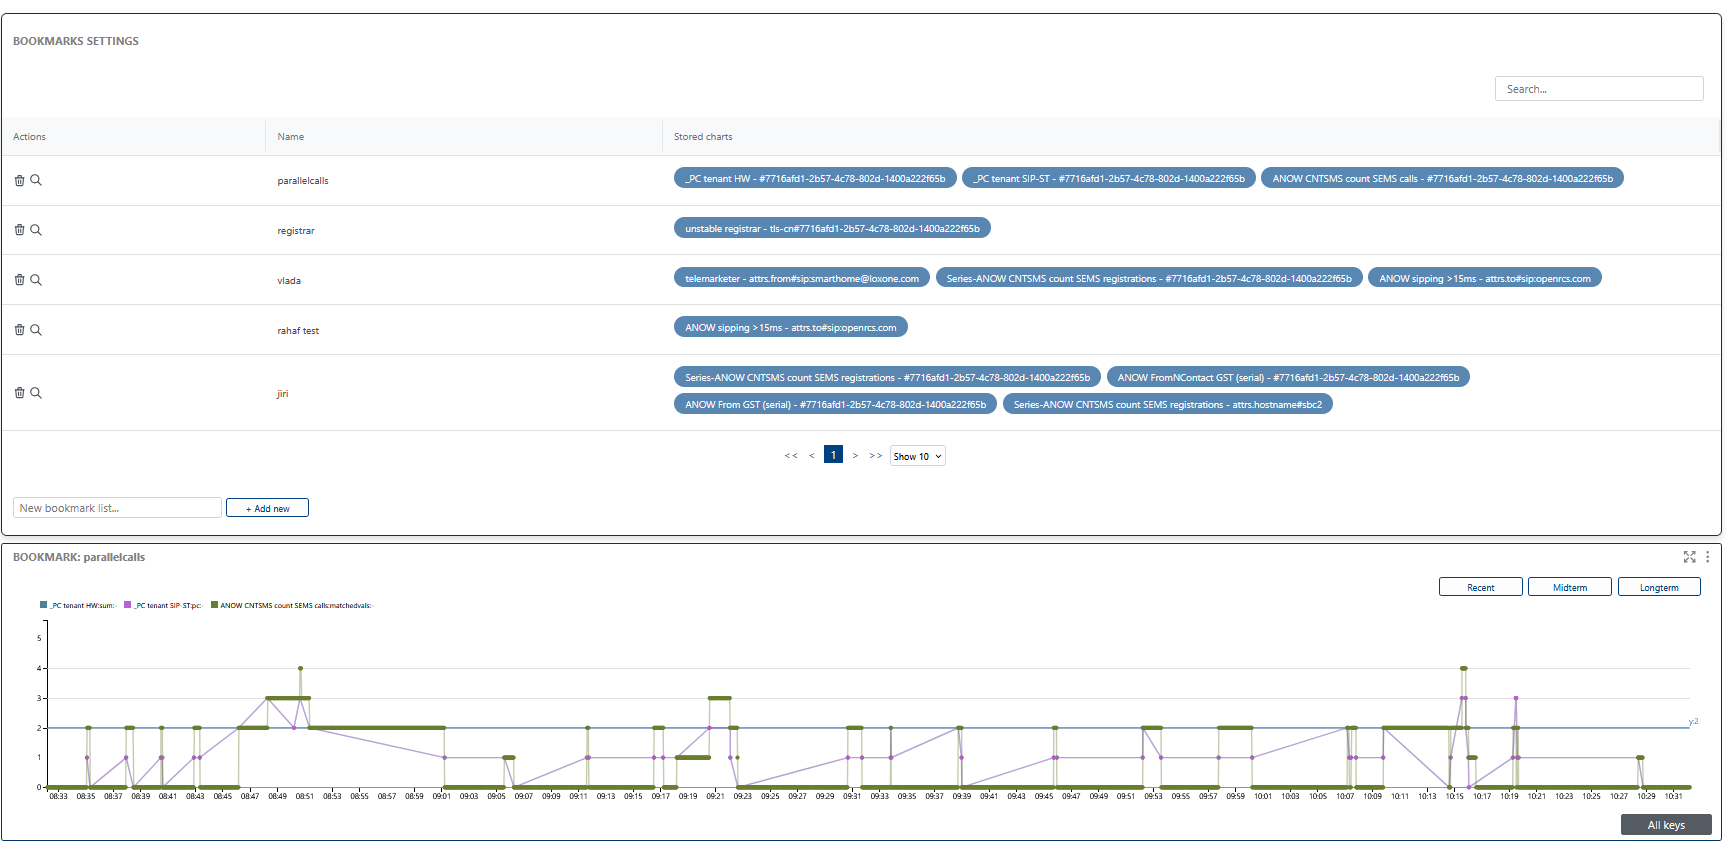
the TimeSeries section visualizes the data and events that you have bookmarked. You can access this visualization by clicking the magnifying glass icon next to a bookmark, providing a clear and interactive way to analyze trends, patterns, and anomalies over time. Use this visualization to gain deeper insights into your alert history and system behavior.
How It Works
- Ingestion: The system ingests incoming JSON events from various data sources (e.g., network equipment, SBCs).
- Stream Mapping: Events are mapped into streams using selected
keys(such as user, trunk, or IP). - Alert Evaluation: Each stream is checked against alerting criteria. If a threshold is exceeded, an alert is triggered.
- Notification/Automation: Alerts are pushed via RESTful plugins or other integrations.
For a detailed explanation of event types and their structure, see the Events Reference.
Footnotes
[1] Z-score is a statistical measure that describes how many standard deviations a data point is from the mean. In alerting, it is used to detect anomalies by identifying values that are unusually high or low compared to historical data. For example, a high z-score may indicate a sudden spike in call attempts or errors, triggering an alert for abnormal behavior.