System Dashboard
Welcome to the System Overview Dashboard! This page summarizes key metrics and node activity for your VoIP infrastructure. Use the tabs below to explore each section in detail.
Main Cards Overview:
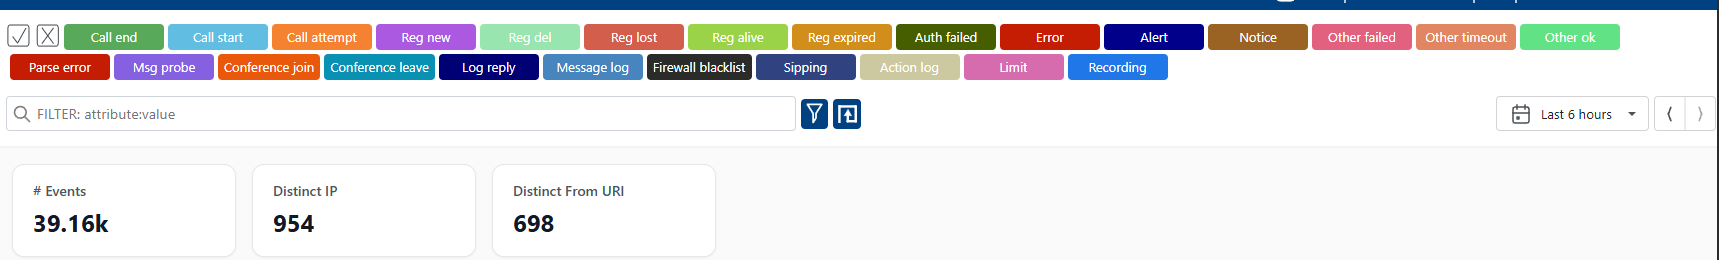
- DISTINCT IP: Number of unique IP addresses observed in system events, useful for tracking network diversity and detecting new or suspicious sources.
- DISTINCT FROM URI: Number of unique SIP From URIs seen in events, helping to monitor user diversity and spot anomalies.
- # EVENTS: Total number of system events recorded, providing a quick measure of overall activity.
- Events Over Time
- Total Events in Interval
- Nodes - Activity
- Nodes - Keep Alive
- Overview Events
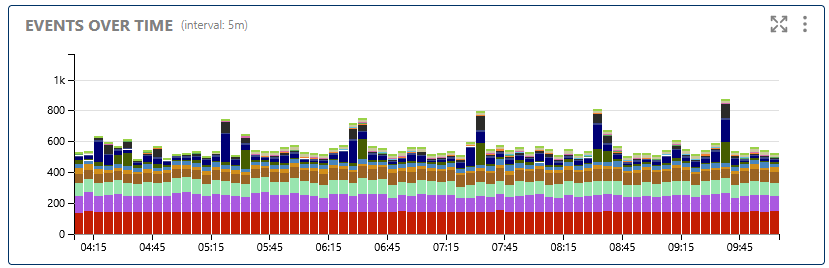
This chart shows the volume of system events over time, helping you monitor trends, detect spikes, and identify periods of unusual activity.
Track the number of system events generated over time to spot anomalies or peak usage.
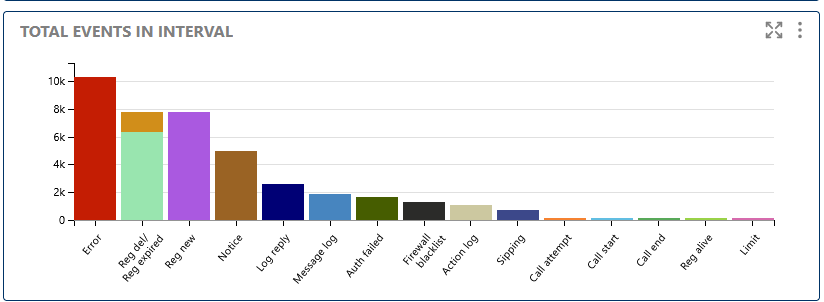
Displays the total number of events recorded within a selected time interval. Useful for quick health checks and comparing system activity across periods.
See the total event count for any chosen interval to assess system load and compare with historical data.

Visualizes the activity status of all nodes in your system, showing which are active, idle, or offline. Helps with capacity planning and fault detection.
Monitor node activity to ensure all components are functioning as expected.
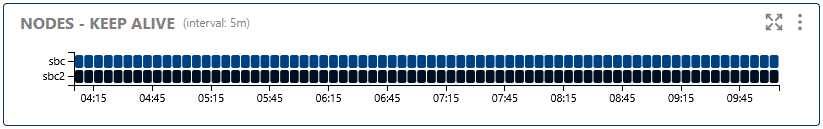
Shows keep-alive signals from nodes, indicating their health and connectivity. Missing keep-alives may signal network issues or node failures.
Watch for missing keep-alive signals, which may indicate connectivity problems or node outages.
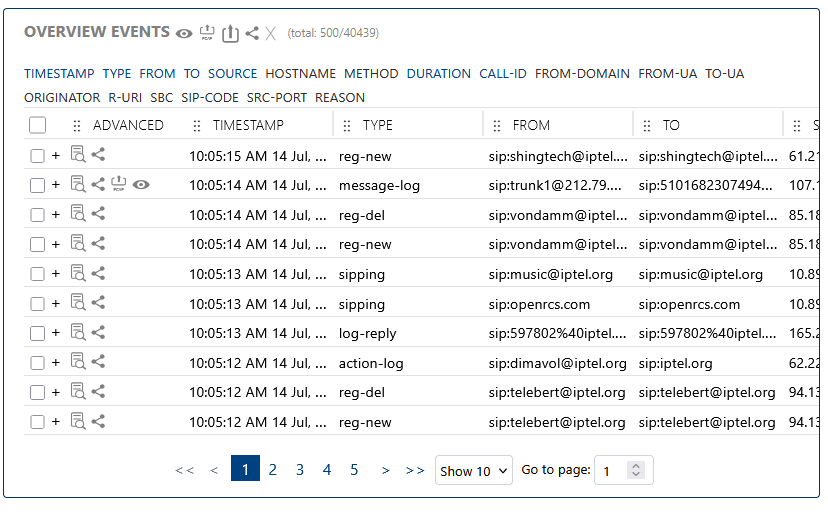
Provides a summary of recent and important system events, giving you a quick snapshot of overall system health and recent changes.
Review key system events for a high-level overview and fast troubleshooting.