Building Custom Charts
Instead of picking a pre-built chart from the catalog, you can construct a chart from scratch using one of two query builders. Open the Add chart drawer (click "Add your first chart" or "+ Add chart") and switch to the "Build new" tab.
Here you can build charts from ElasticSearch data (ES Builder) or from Prometheus time-series metrics (Prometheus Query Builder).
ES Builder (ElasticSearch Query Builder)
The ES Builder lets you build charts from ElasticSearch-indexed data streams. Configure your chart step by step:
Step 1 — Data Stream
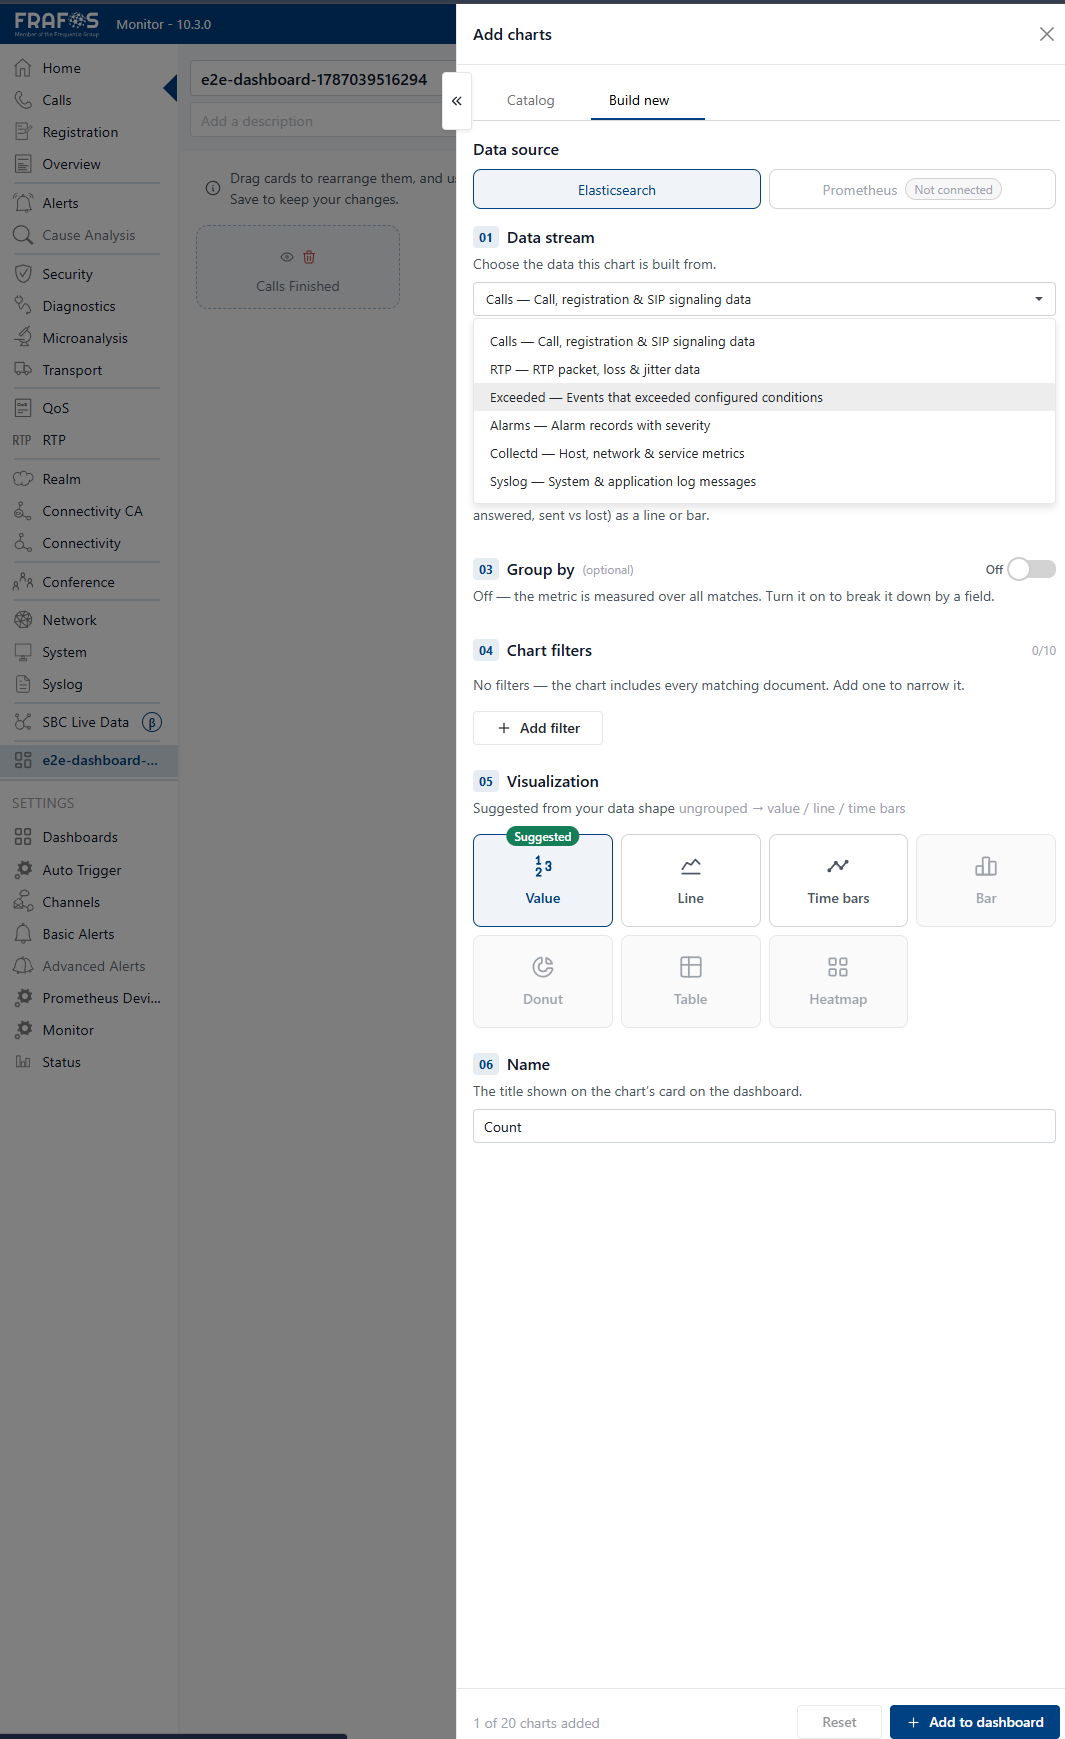
Search or choose the data source this chart will query from. Type a keyword in the search input to filter the available data streams, or browse the full list:
| Data stream | Description |
|---|---|
| Calls | Call, registration & SIP signaling data |
| RTP | RTP packet, loss & jitter data |
| Exceeded | Events that exceeded configured conditions |
| Alarms | Alarm records with severity |
| Collectd | Host, network & service metrics |
| Syslog | System & application log messages - from the SBC |
Step 2 — Metric
Select an aggregation type and the metric field to aggregate:
- Aggregations:
count,sum,avg,min,max,cardinality - Field: Choose the specific field from the selected data stream.
Step 3 — Compare (Optional)
Toggle "Compare" to enable a secondary metric, allowing you to display a comparison between two different aggregations side by side.
Compare cannot be used together with Group by. If Group by is enabled, the Compare option will be locked.
Step 4 — Group by (Optional) - Metric
Group the results by a selected field. You can also configure:
- Size — number of top groups to show
- Order — ascending or descending
- OrderBy — which metric to sort by
Group by cannot be used together with Compare.
Step 5 — Filters
Add filters to narrow down the data. Supported filter operators:
| Operator | Description |
|---|---|
is | Exact match |
is_not | Not equal to |
exists | Field has a value |
not_exists | Field is empty or missing |
gt | Greater than |
lt | Less than |
between | Between two values |
contains | Value contains the specified text |
Step 6 — Visualization Type - Metric
Choose how the data is rendered. The app suggests compatible visualization types based on your data configuration:
| Visualization | Description |
|---|---|
| Value | A single numeric value |
| Line | Time-series line chart |
| Time bars | Bar chart showing time-distributed data |
| Bar | Categorical bar chart |
| Donut | Donut/pie chart |
| Table | Tabular data with multiple rows/columns |
| Heatmap | Intensity-based grid visualization |
Heatmap visualizations always span the full 12-column width of the grid.
Step 7 — Name - Metric
Enter a title for the chart (max. 60 characters). This title is displayed on the chart card within the dashboard.
Live Preview - Metric
As you configure the chart, a live preview pane updates in real-time, showing you a sample of the data visualized with your current settings. You can collapse and expand this preview at any time.
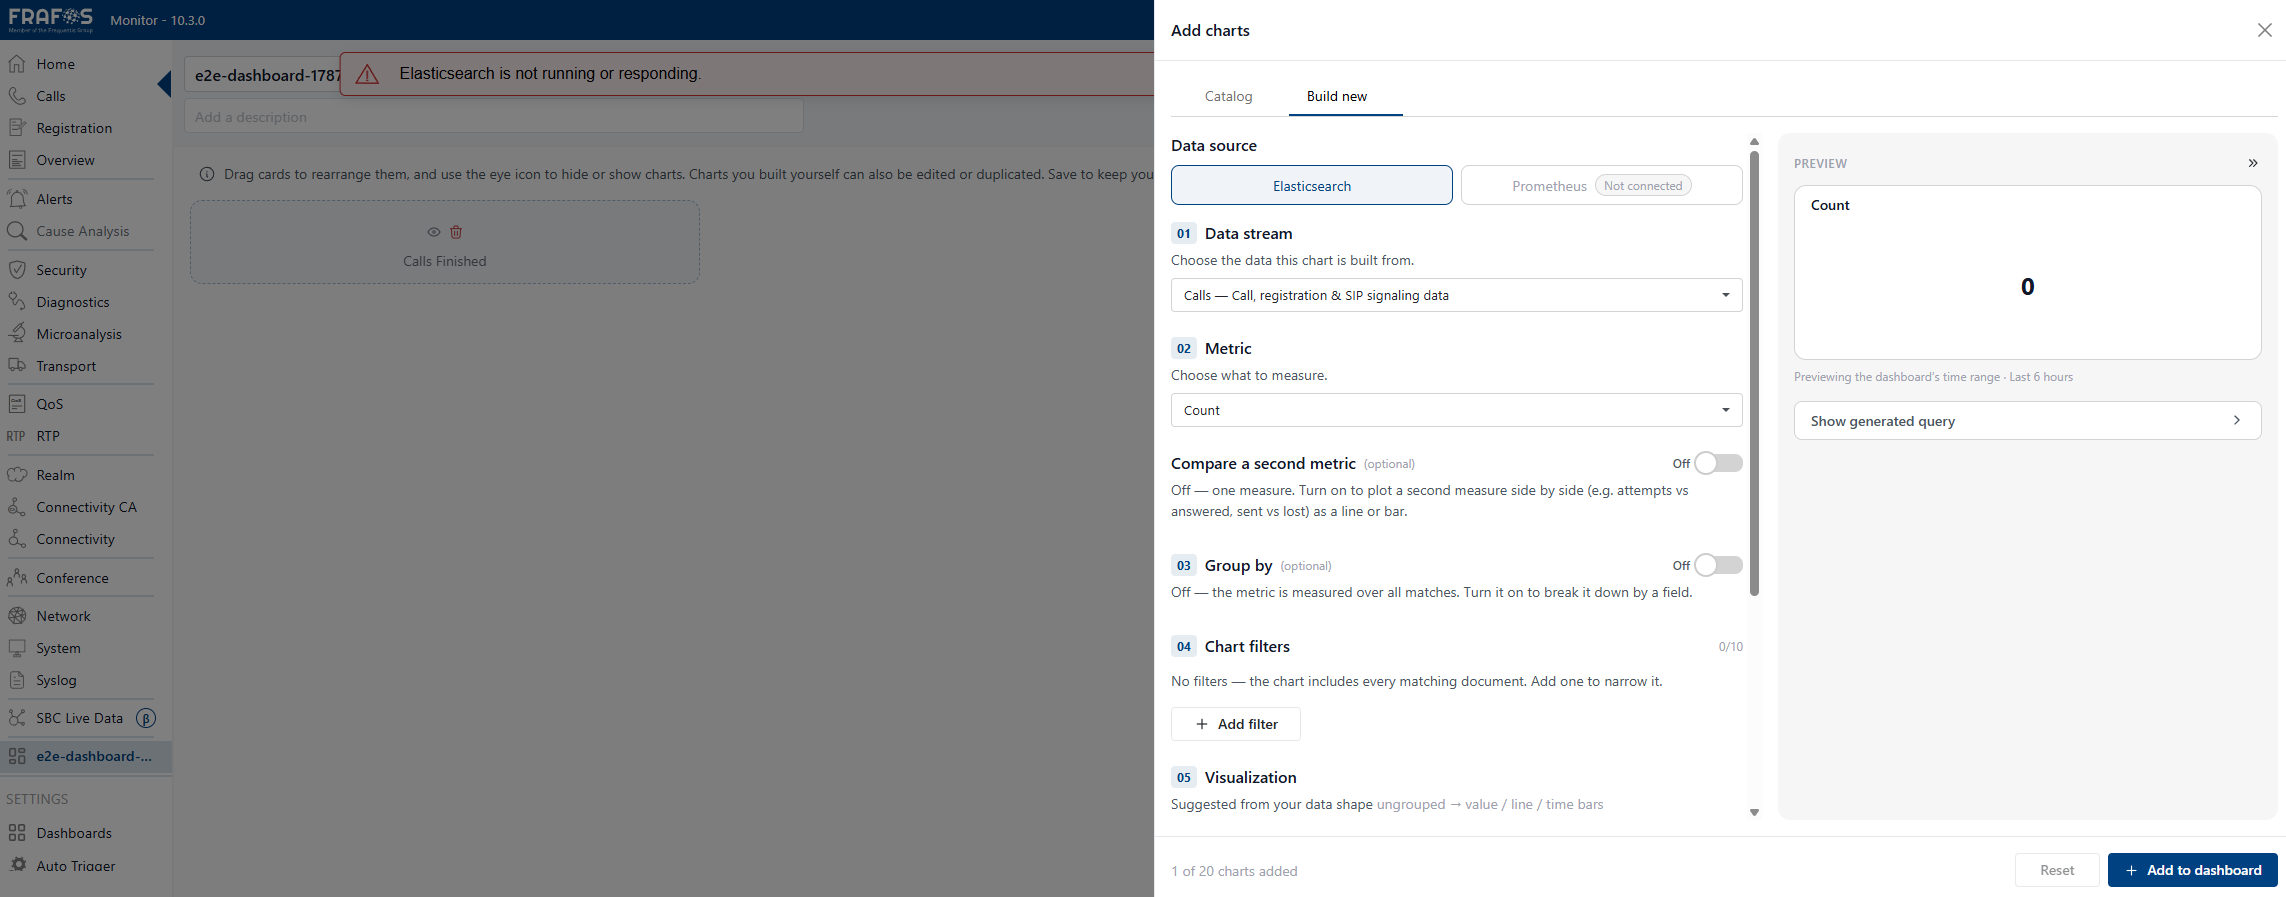
Click "Add to dashboard" to place the new chart on the grid, or click "Reset" to start fresh with a new configuration.
If the "Add to dashboard" / "Reset" buttons are not visible, scroll to the bottom of the drawer.
Prometheus Query Builder
The Prometheus Query Builder is available only if Prometheus is configured in your environment. If not configured, a notice will appear explaining how to set it up.
The Prometheus builder lets you create charts from Prometheus time-series metrics:
Step 1 — Metric
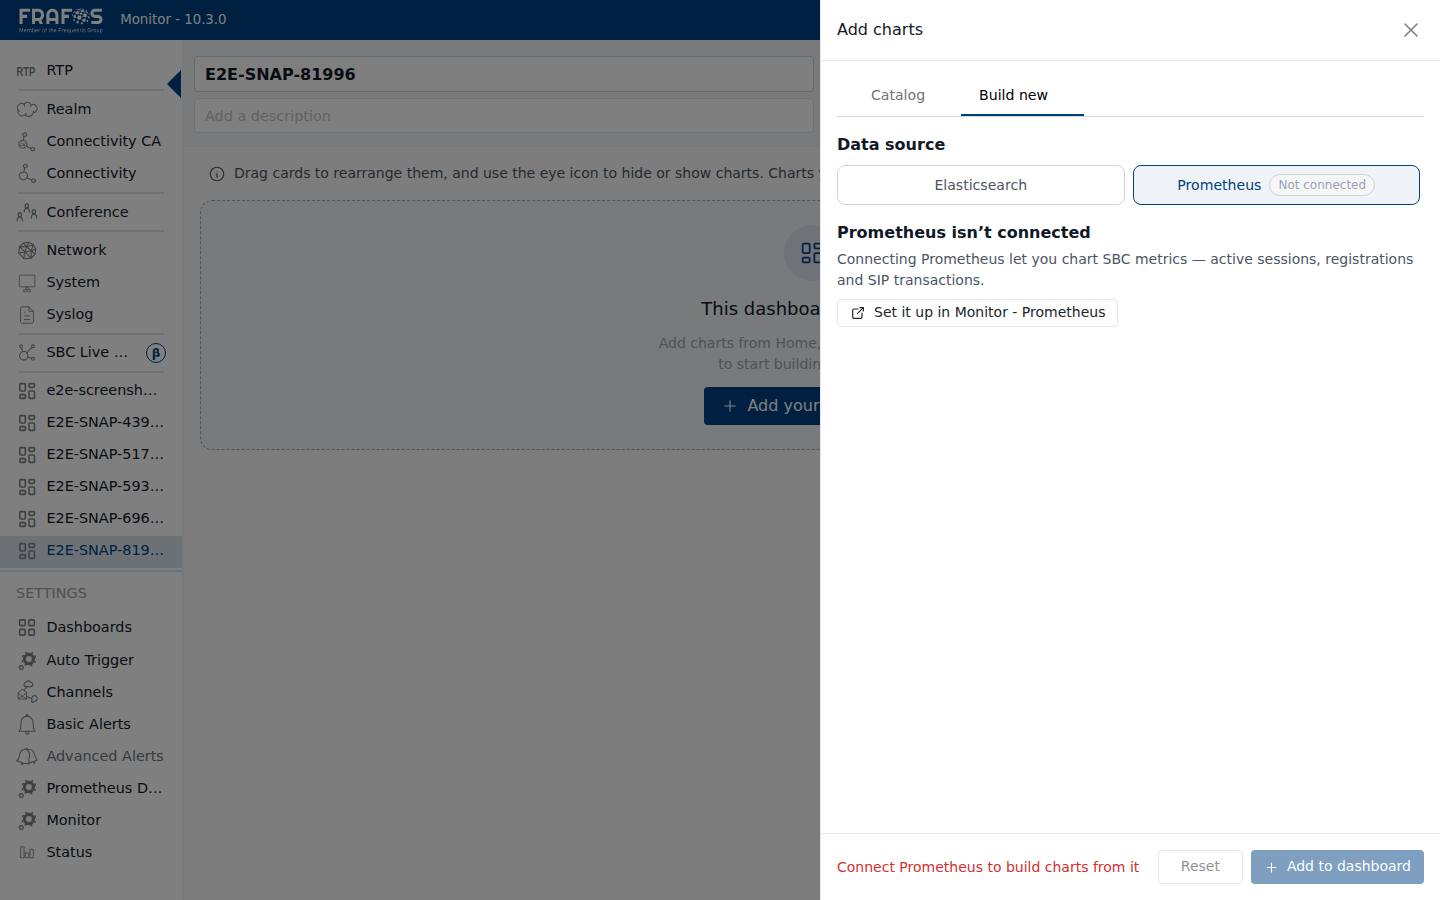
Select a Prometheus metric from the dropdown list. If Prometheus is not connected, a notice will appear below the data source selector explaining how to set it up:
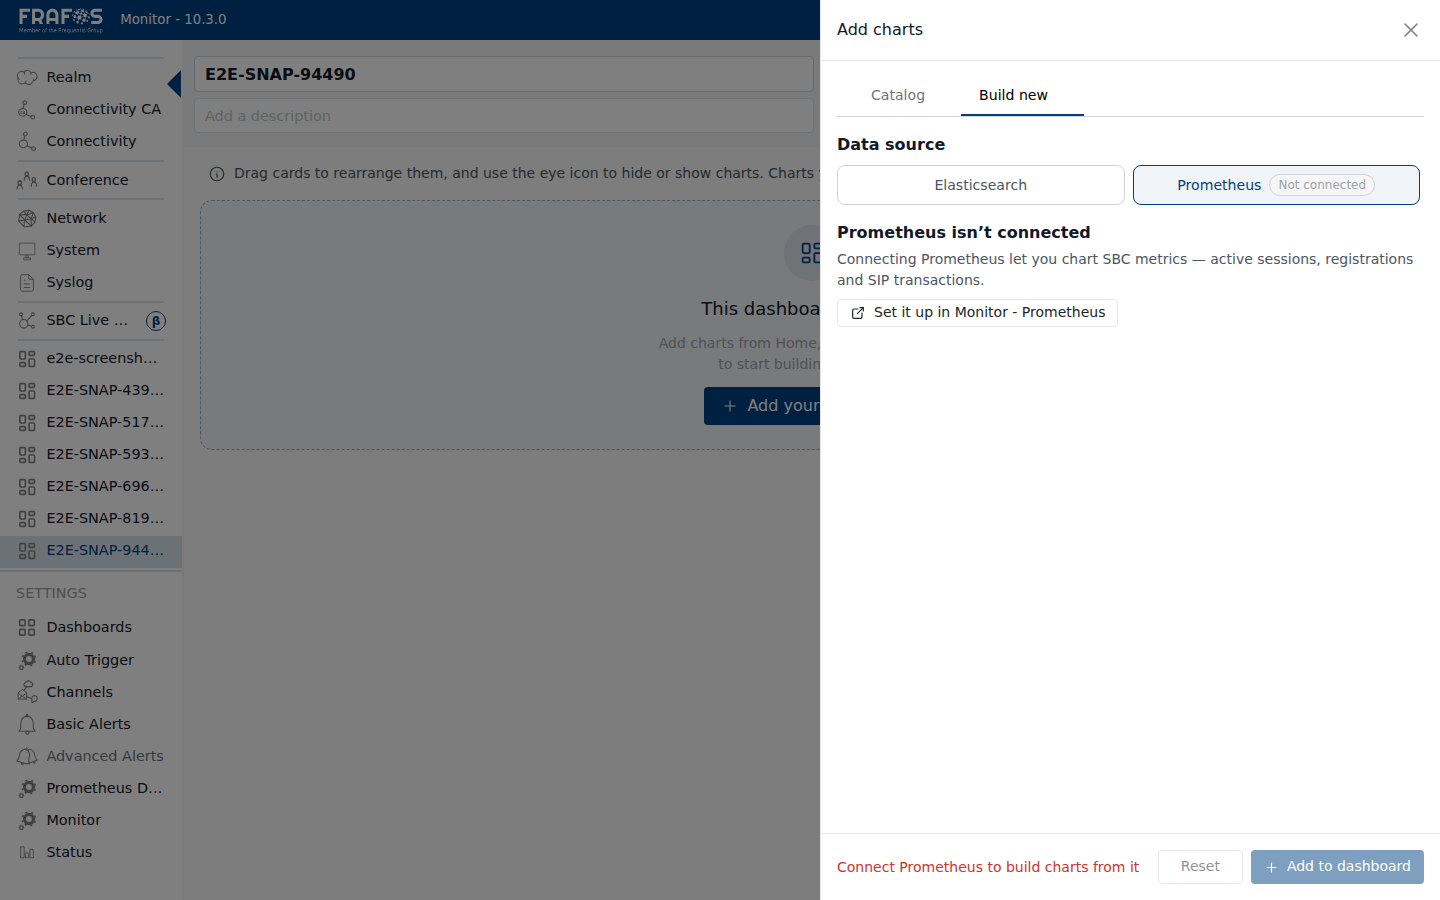
The metric picker is a dropdown with a fixed list of available SBC metrics (sessions, register cache, transactions, SIP messages, etc.). Type to filter by keyword, or scroll to browse.
Step 2 — Function
Choose a Prometheus aggregation function:
| Function | Description |
|---|---|
| Instant | Raw instantaneous value from Prometheus |
| avg_over_time | Average value over a specified time range |
| rate | Per-second average rate of increase (for counter metrics) |
| increase | Total increase over a specified time range |
Step 3 — Label Matchers
Filter metrics by label key-value pairs. Supported operators:
| Operator | Description |
|---|---|
eq | Equal to (exact match) |
neq | Not equal to |
re | Regex match |
nre | Not regex match |
Example: job="moki", instance=~"sbc-.*".
Step 4 — Group by (Optional)
Group the results by a specific label to produce multiple time series.
Step 5 — Topk (Optional)
Limit the number of resulting time series to the top k values.
Step 6 — Visualization Type
Choose from:
| Visualization | Description |
|---|---|
| Value | Single numeric value |
| Line | Time-series line chart |
| Bar | Categorical bar chart |
| Table | Tabular data |
Unlike ES Builder, Prometheus builder supports fewer visualization types (no donut, heatmap, or timebar).
Step 7 — Name
Enter a title for the chart (max. 60 characters).
Live Preview
Just like ES Builder, a live preview pane shows a sample of the data as you configure the query.
Builder Validation and Error Handling
Understanding the builder's validation system and error handling is crucial for creating charts efficiently. This section covers all validation states, common blockers, and error scenarios you may encounter.
Understanding Builder State
The chart builder has several states that control when you can add or save your chart:
Idle State
- No data selected
- "Add to dashboard" button is disabled
- Form fields are empty with placeholder text
- Validation is not active (no red borders or error messages)
- Live preview shows "Select a data stream to begin"
In-Progress State
- You're actively filling out the form
- "Add to dashboard" button is disabled until all required fields are valid
- Validation occurs as you type or when you tab away from fields (debounced ~300ms)
- Required fields without values show subtle border highlighting (not yet red)
Valid State
- All required fields are filled and pass validation rules
- "Add to dashboard" button becomes enabled (no longer grayed out)
- Cursor shows pointer on hover, indicating clickability
- Live preview displays actual sample data
Error State
- One or more validation rules failed
- Error message appears near the invalid field
- Field border turns red to draw attention
- "Add to dashboard" button remains disabled
- Red error text provides actionable guidance
Builder Blockers: Why the "Add to Dashboard" Button Is Disabled
The primary blocker preventing chart creation is the disabled state of the "Add to dashboard" button. Here are the most common reasons:
1. No Data Stream Selected
Description: You haven't selected a data stream yet, which is required for the ES Builder.
How to fix: Click the data stream dropdown and select one from the list:
- Calls, RTP, Exceeded, Alarms, Collectd, or Syslog
UI indicator:
- Dropdown shows placeholder:
"Select data stream" - Subsequent fields (metric, visualization, title) remain disabled
- No metric options appear in the metric picker
2. No Metric Selected
Description: You haven't selected a metric to visualize from your chosen data stream.
How to fix: Open the metric picker dropdown and choose a metric. For Elasticsearch, you can:
- Select an aggregation type (
count,sum,avg,min,max,cardinality) - Choose a specific field to aggregate
UI indicator:
- Metric dropdown shows placeholder:
"Select metric" - Group by, filters, and visualization options are disabled
- Title field is empty
3. Chart Title Required
Description: Every chart must have a unique title. The chart title is displayed on the chart card within the dashboard.
How to fix: Enter a descriptive title for your chart in the "Name" field.
UI indicator:
- Title input shows placeholder:
"Enter chart title" - Character counter displays:
"0 / 60 characters" - Title border turns red if submitted empty
- "Add to dashboard" button shows tooltip:
"Enter a chart title"
Note: Maximum 60 characters are enforced. If you exceed this limit, the input will show a character count in red and refuse to save.
4. Visualization Type Invalid
Description: The selected visualization type doesn't support the chosen metric or data type.
How to fix: Change the visualization type or choose a compatible metric:
- Value visualizations require single numeric aggregations
- Line and Time bars require time-series data
- Donut and Bar require categorical data
- Table can display most data types
- Heatmap is reserved for high-volume time-series data
UI indicator:
- Error message:
"[Metric] is not compatible with [Visualization]" - Visualization dropdown border turns red
- Helpful suggestion appears:
"Try using Line visualization for time-series data"
5. Comparison Not Valid (Conflict Resolution)
Description: Some comparison configurations are not allowed due to feature conflicts.
How to fix: Choose one of the following:
- Remove the comparison to enable Group by
- Remove Group by to enable comparison
- Keep both features disabled for simple visualization
UI indicator:
- Conflict message appears in a warning box (yellow background)
- Disabled option shows strikethrough
- Tooltip explains:
"Cannot use Compare with Group by. Disable one to enable the other."
6. Required Field Empty
Description: A required field is empty beyond just title.
Common required fields:
- Data Stream: Where to fetch data from (ES Builder)
- Metric: What to visualize (both builders)
- Visualization Type: How to display data
- Prometheus Metric: Specific Prometheus metric name
How to fix: Fill in all required fields before clicking "Add to dashboard"
UI indicator:
- Field border turns red
- Red error message appears below field
- "Add to dashboard" button shows tooltip explaining the blocker
7. Prometheus Not Connected
Description: Prometheus is configured in Moki but not actively connected to your environment.
How to fix:
- Contact your system administrator to configure Prometheus connectivity
- Use ES Builder as an alternative while Prometheus setup is in progress
UI indicator:
- Notice appears below data source selector:
"Prometheus is not configured. Please contact your administrator." - Prometheus Query Builder tab is disabled
- Alternative: Use ES Builder with available data streams
Live Preview Pane Behavior
The live preview pane is a critical component for verifying your chart configuration before adding it to the dashboard.
Location
The preview pane is located at the bottom of the builder drawer form.
What It Shows
| Element | Description |
|---|---|
| Chart Rendering | The actual chart visualized with sampled data |
| Grid Lines | Automatic grid lines for time-series charts |
| Axis Labels | X and Y axis labels (when applicable) |
| Legend | Metric names and comparison labels |
| Data Points | Sample data points from actual queries |
Update Behavior
The preview updates automatically with the following characteristics:
Automatic Updates:
- No manual "preview" button required
- Updates within ~500ms of form changes (debounced)
- Updates on:
- Data stream selection change
- Metric field change
- Visualization type change
- Filter modifications
- Group by configuration
Loading State:
- Shows
"Loading..."spinner while fetching data - Displayed for 300-2000ms depending on query complexity
- Cannot interact with builder while loading
Sample Data:
- When full fetch would be expensive, preview shows sampled data (first 10-20 rows)
- Indicator shows:
"Showing sample data (first 10 results)" - Actual query runs on save
Empty Preview State
When no valid configuration exists:
- Displays:
"Select a data stream to begin building your chart" - Grayed-out placeholder icon
- No chart rendering, just helpful text
Error Preview State
When data fetch fails:
- Displays error message in red:
"Failed to fetch data. Check your filters or try again." - Shows last known valid data with strikethrough indicator
"Retry"button appears to re-fetch data
Collapsible Preview
The preview pane is collapsible:
- Click header to expand/collapse
- Useful when working on complex configurations
- State is preserved during form edits
Error Scenarios and How to Handle Them
Network Error
Scenario: Backend API is unavailable, slow, or times out.
User Experience:
- Live preview shows
"Loading..."indefinitely - After 10 seconds, error toast appears:
"Failed to fetch data. Please try again." - Preview pane shows error state with red background
- You can continue filling out the form
- Click
"Retry"button to re-fetch data when ready
What Happens:
- Builder remains fully usable
- You can submit even if preview failed
- Final save will retry the API call with fresh data
- On successful save, chart is added regardless of preview state
Best Practice:
- If preview fails multiple times, proceed with form submission
- Chart will validate and save on backend even if preview couldn't load
- Check dashboard after save to verify chart appears correctly
Query Validation Error
Scenario: Your configuration contains syntax errors or incompatible settings.
User Experience:
- Click
"Add to dashboard" - Form doesn't close
- Red border appears around invalid field
- Error message appears:
"Invalid query syntax"or"No data matches your filters" - Suggested fix appears:
"Try adjusting your filters"or"Check your metric name"
Common error messages and fixes:
| Error Message | Likely Cause | How to Fix |
|---|---|---|
"Field 'status' not found in data stream" | Typo in field name | Re-select from available fields |
"Invalid aggregation type for field" | Wrong aggregation | Use count for text fields, numeric aggregations for numbers |
"Filter value is required" | Empty filter input | Enter a value for the filter |
"Time range exceeds maximum" | Too wide time window | Narrow the dashboard time range |
How to Fix:
- Read the error message carefully
- Look at the red field border to identify which field is invalid
- Update the field to meet requirements
- Click
"Add to dashboard"again
Form Fields Reference
Required Fields
| Field | Builder | Purpose | Constraints |
|---|---|---|---|
| Data Stream | ES Builder | Source of data | Cannot be empty |
| Metric | Both | What to visualize | Must be valid metric |
| Visualization Type | Both | Display format | Must match metric type |
| Title | Both | Chart name | Required, max 60 chars |
| Metric (Prometheus) | Prometheus | Specific metric | Required for Prometheus |
Optional Fields
| Field | Builder | Purpose | Notes |
|---|---|---|---|
| Function | Prometheus | Aggregation type | Instant, avg, rate, increase |
| Label Matchers | Prometheus | Filter by labels | Key=value syntax |
| Group by | Both | Categorize results | Conflicts with Compare |
| Compare | ES Builder | Dual metric display | Conflicts with Group by |
| Filters | ES Builder | Narrow data set | Multiple operators available |
| Topk | Prometheus | Limit results | Top N values only |
| Description | Both | Chart notes | Not displayed on chart |
| Time Range | Both | Override defaults | Dashboard default if unset |
| Custom Settings | Both | Visualization options | Type-specific |
Related Features
- Catalog Charts — Pre-built charts that don't need builder
- Edit Mode — Modify existing custom charts
- Dashboard Manager — Reorder and manage dashboards
- Chart Limits — 20 charts per dashboard maximum
- Creating Custom Dashboards — Create dashboard from scratch