Dashboard reference
This page documents the dashboard UI and the key fields that must be defined in a report for it to run successfully.
Dashboard overview

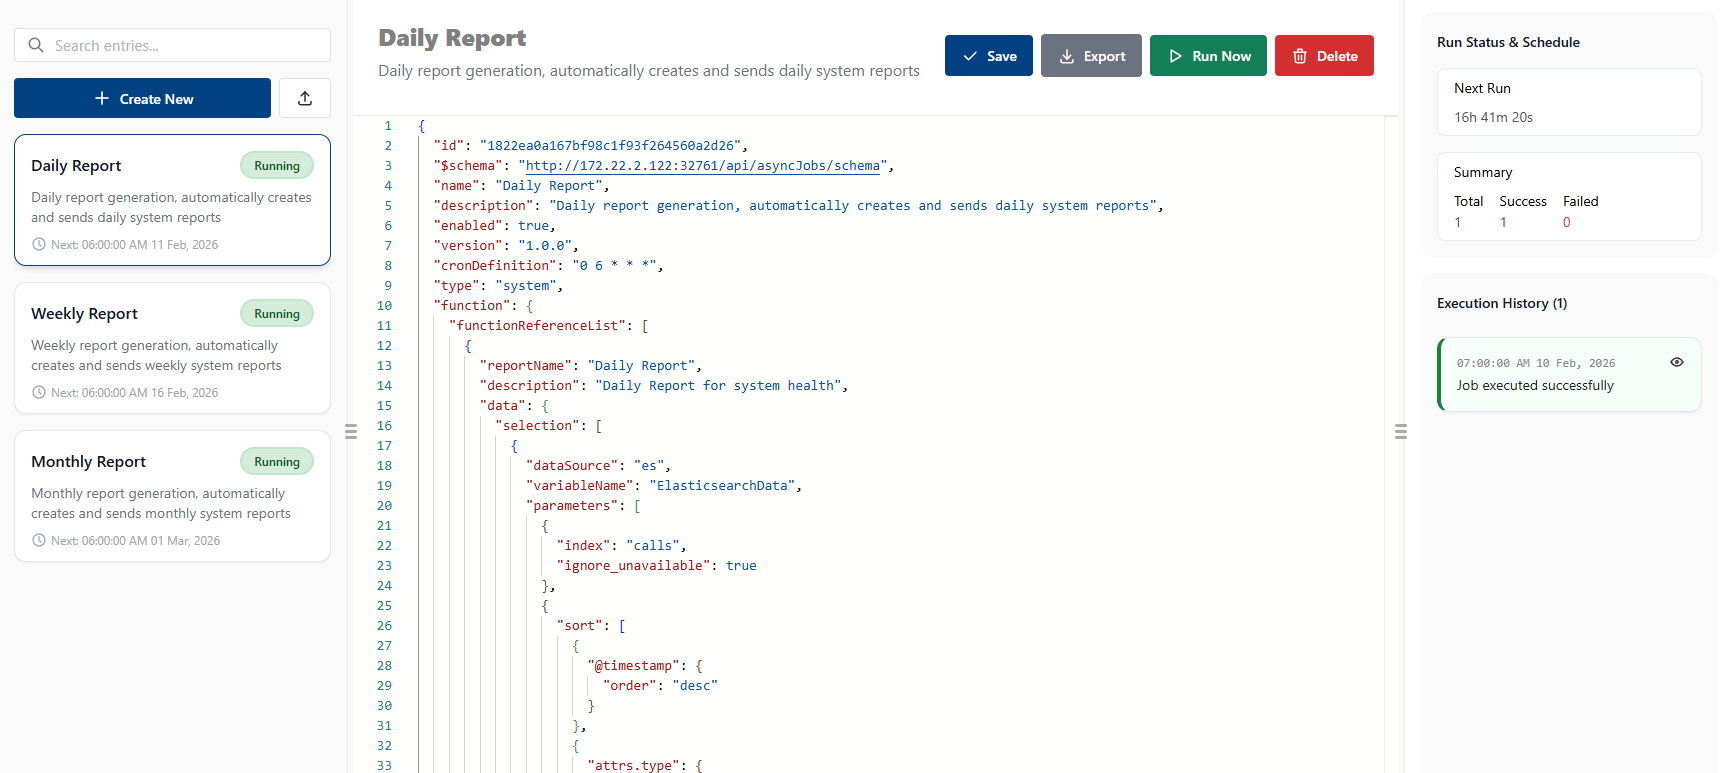
Dashboard Actions - Left Side
- Create new: Create new report definition from a template.
Report Actions - Middle
- Save: Save changes made in the JSON editor.
- Run Now: Immediately execute the report and log the results.
- Export : Download the report definition as a JSON file for backup or sharing.
- Delete: Remove the report definition.
Execution History - Right Side
- Displays a list of past executions with timestamps, status, and messages.
- Click an entry to view detailed logs and download generated files.
JSON editor fields

Report creation stages
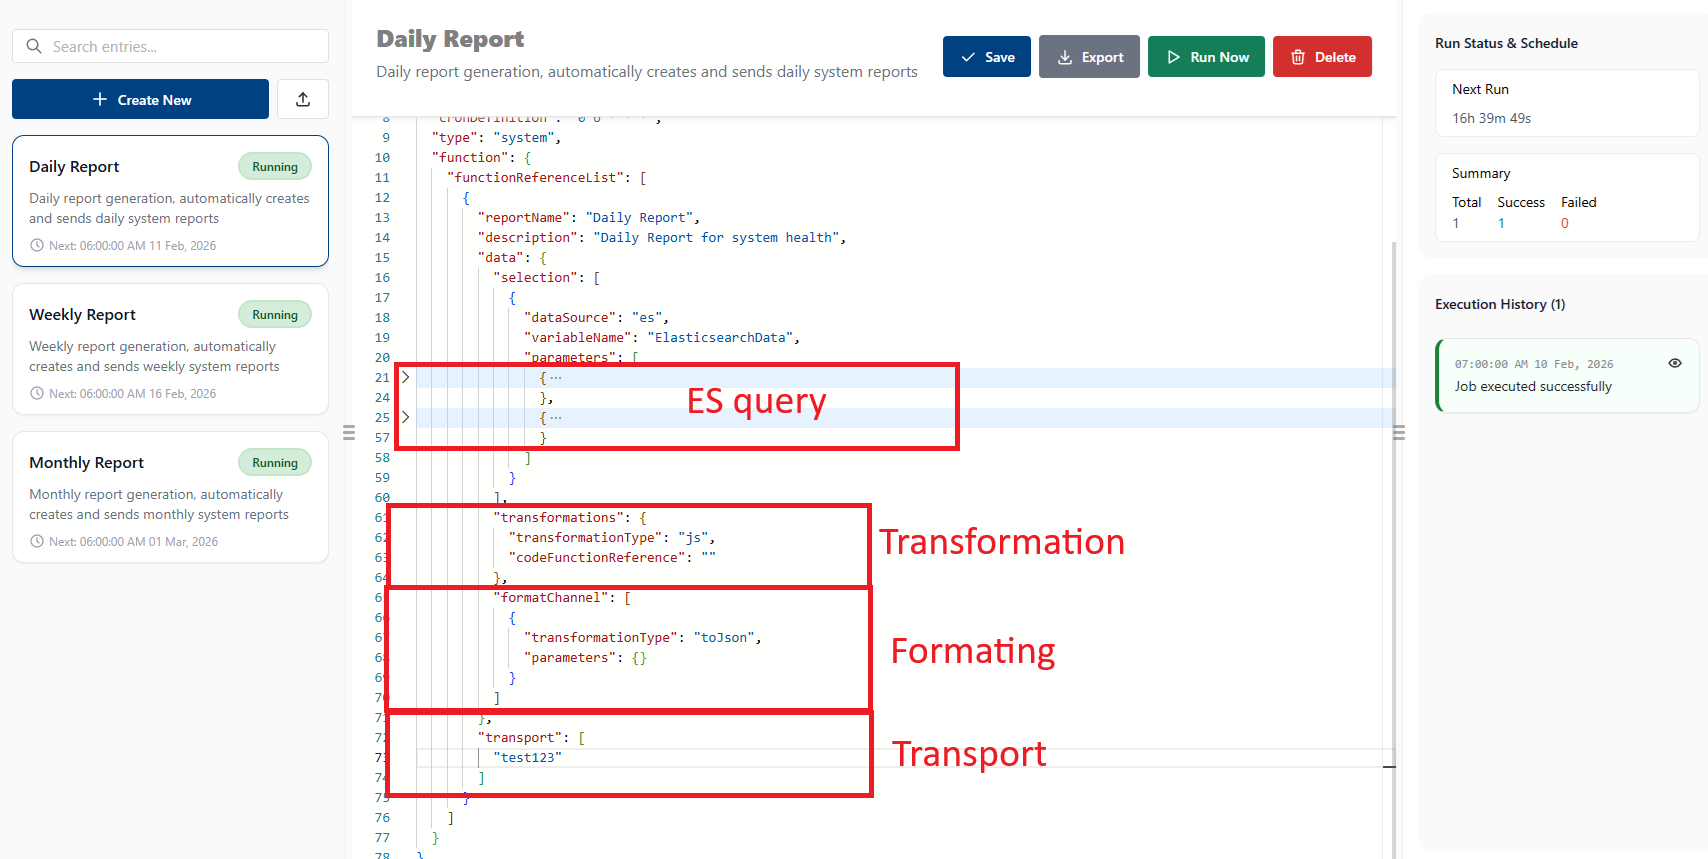
The report creation process is broken into stages. Each stage supports multiple entries where noted.
Data selection
- Step: choose one or more queries/data sources to include in the report.
- Notes: Combine multiple queries (different indices/sources) into a single report. Each selection becomes an input stream for downstream stages.
Data transformation
- Step: apply optional transformations to the raw data.
- Notes: Transformations are applied per input stream and can be used for filtering, enrichment, or aggregation. This is currently extendable.
Formatting
- Step: convert transformed data into one or more output formats (JSON, CSV, etc.).
- Notes: A report may produce multiple formatted outputs in parallel (for example, CSV for an email attachment and JSON for a webhook payload).
Transport

- Step: deliver formatted outputs to one or more transports (email, webhooks, SNMP, etc.).
- Notes: Each formatted output can be routed to multiple transports.
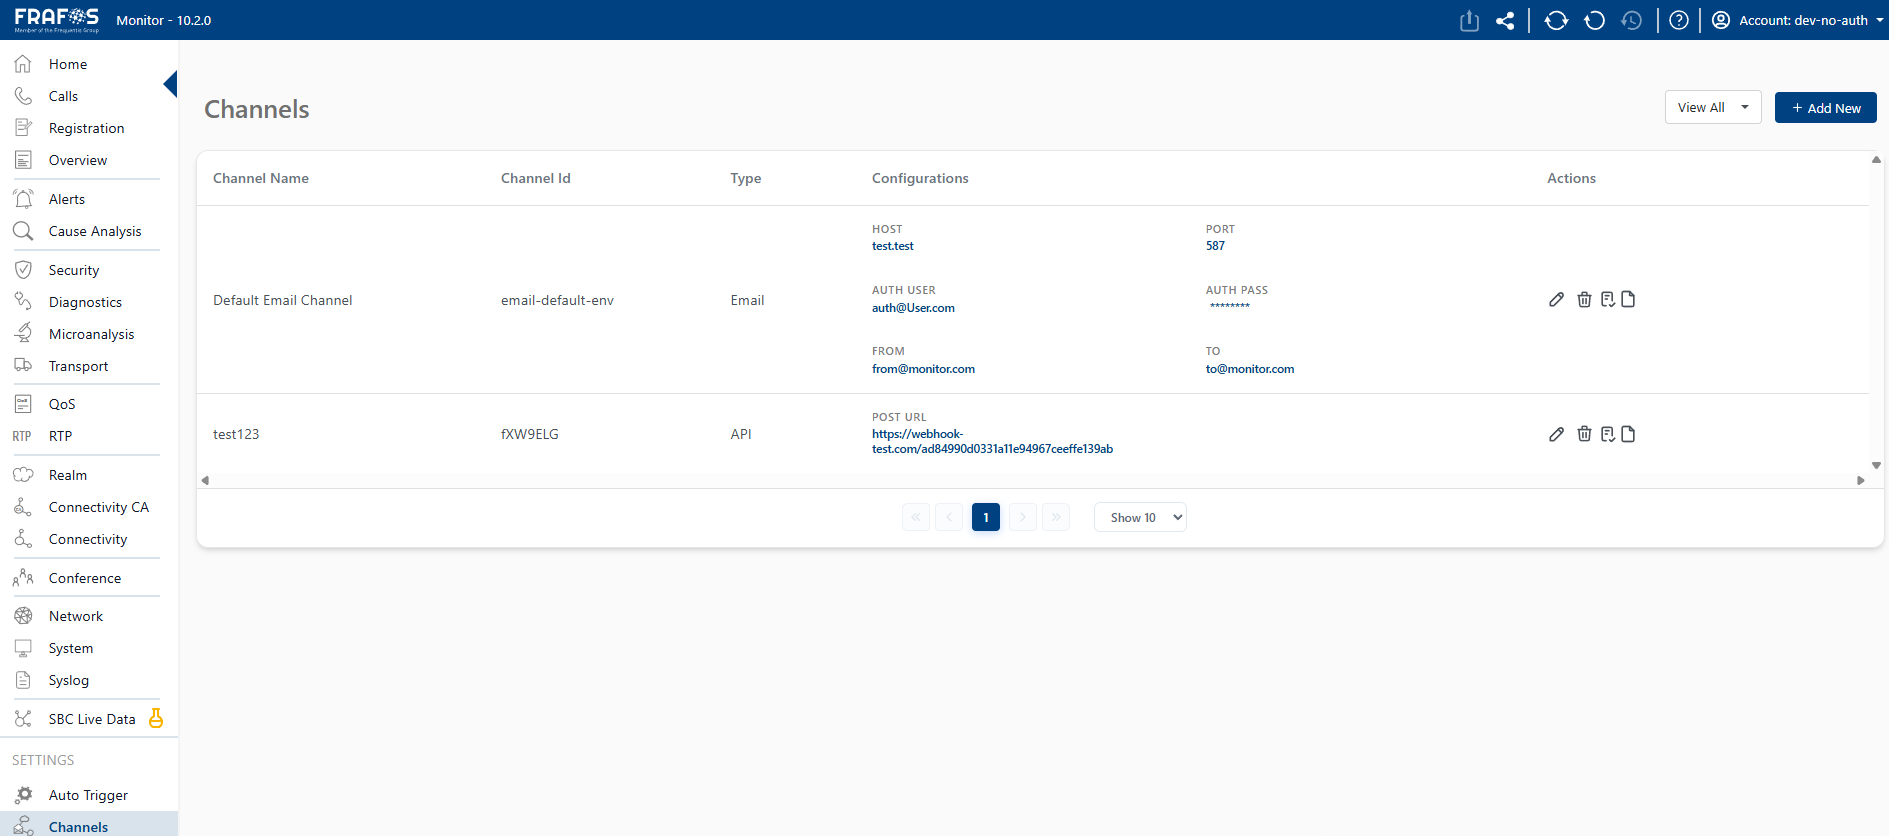
- For the transport definition the
ChannelIdshould be used in the array.
Log detail

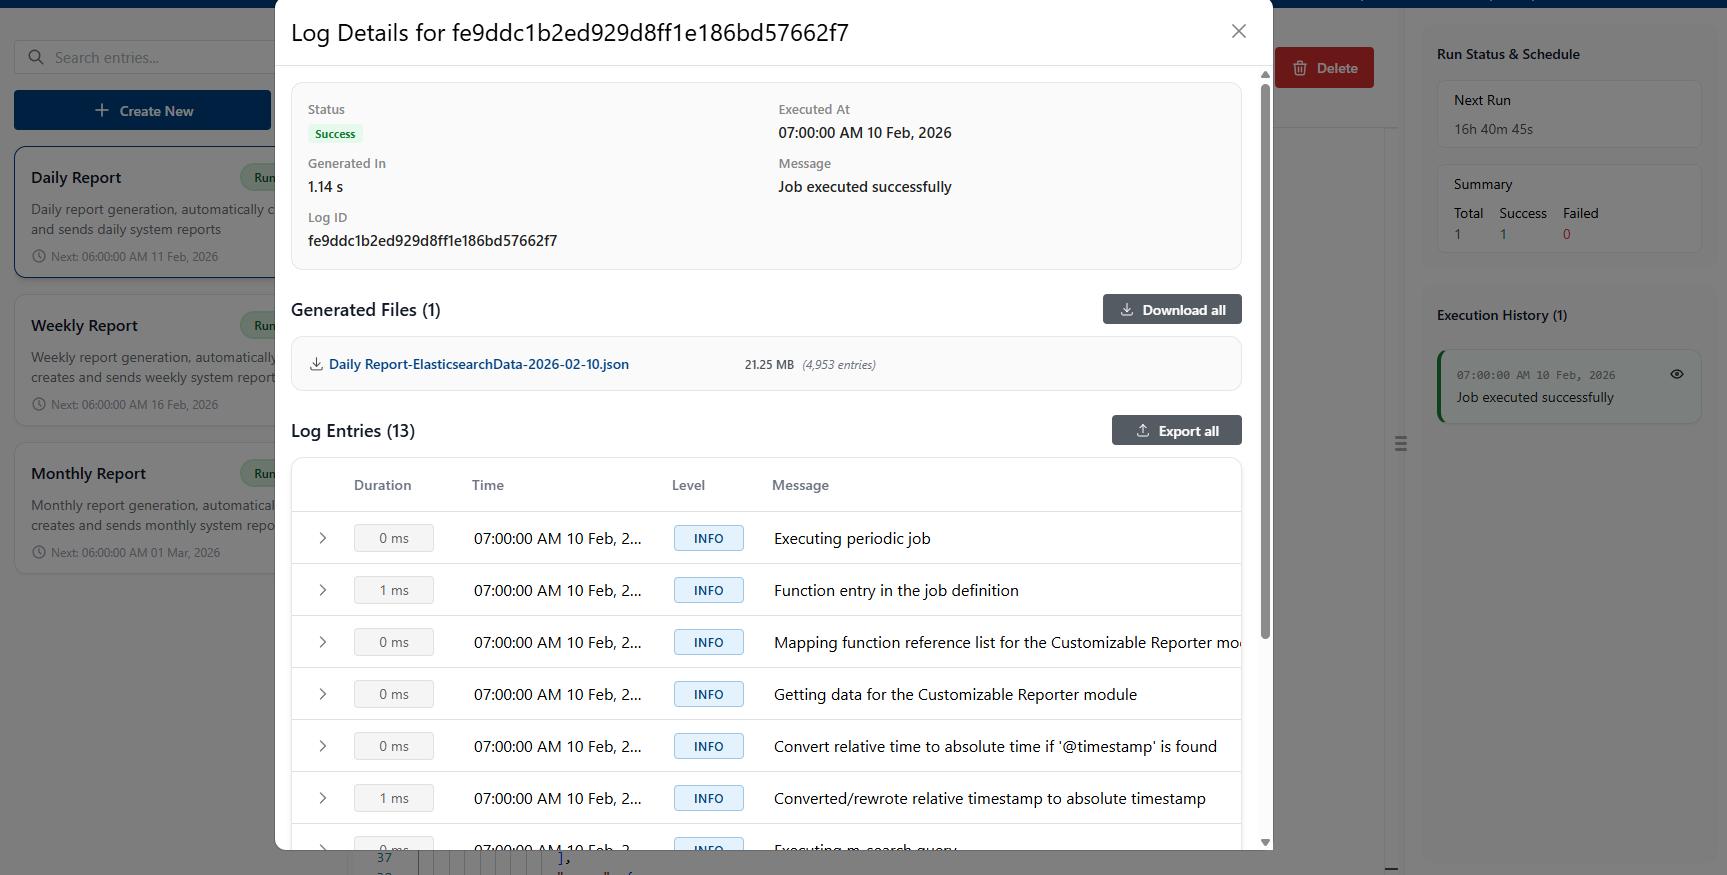
Log entry fields
- Executed at: The date and time when the log entry was created.
- Status: The status of the log entry (e.g., INFO, ERROR, SUCCESS,..).
- Message: A descriptive message providing context about state of the job.
- Log ID: A unique identifier for the log entry.
- Download files: Download any files generated during the execution of the report.
- Note: The maximum number of entries shown under "Generated Files" is 10 000. This matches the default maximum hit limit for an Elasticsearch response, so very large executions may be truncated.
- Download logs: Download the log entries as a file for offline review.
See Also
- Pipeline Configuration - Comprehensive reference for all pipeline components
- Details - Overview of key features and schema structure