QoS Dashboard
Welcome to the Quality of Service (QoS) Dashboard! This page provides insights into call quality metrics, MOS statistics, and low QoS events. Use the tabs below to explore each metric in detail.
- QoS Histogram
- MoS Stats
- Low QoS Events
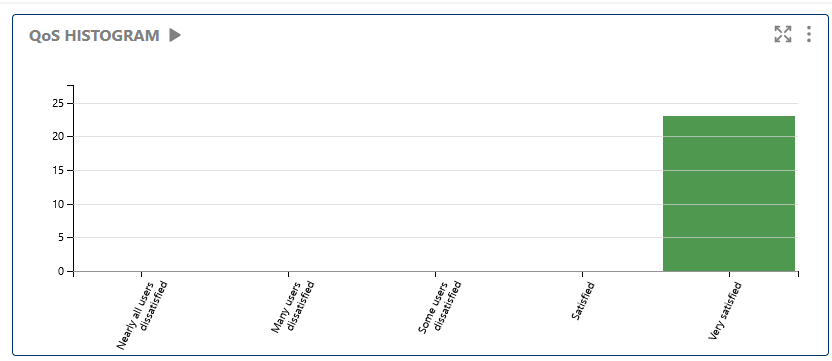
This chart displays the distribution of call quality scores, helping you identify the most common quality levels and spot outliers.
Use the histogram to quickly assess the overall quality distribution of your calls.

Shows detailed statistics for Mean Opinion Score (MOS), a key indicator of perceived call quality in VoIP systems.
Monitor MOS stats to track trends in call quality and detect periods of degradation.
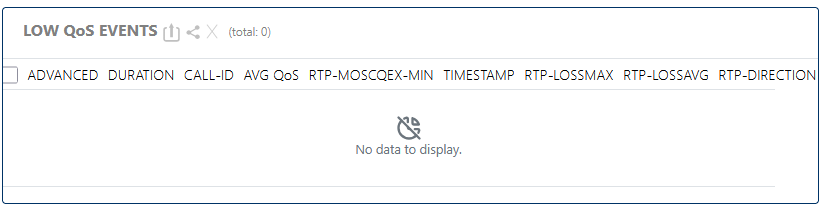
Lists events where call quality dropped below acceptable thresholds, helping you identify and troubleshoot problem calls.
Investigate low QoS events to address network or configuration issues affecting call quality.