Cause Analysis Dashboard
Welcome to the Cause Analysis Dashboard! This page helps you investigate call and event patterns, identify root causes, and compare snapshots for troubleshooting. Use the tabs below to explore each metric in detail.
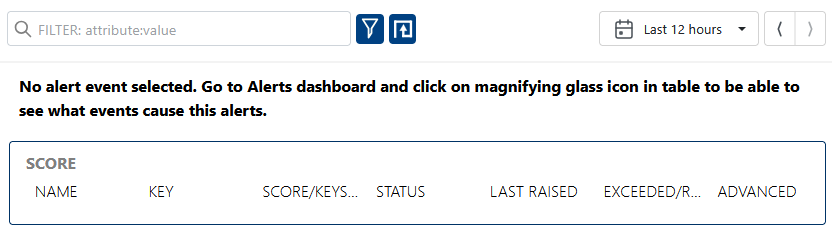
Example: The dashboard when no alert is selected.
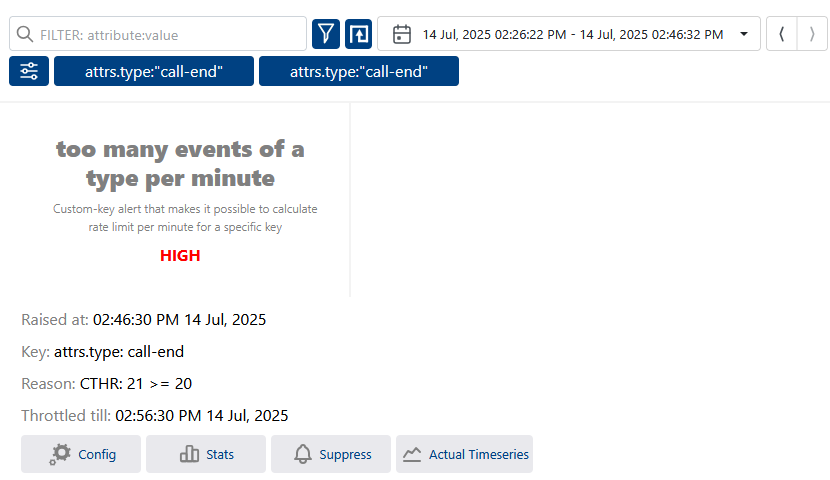
Example: The dashboard when an alert is selected. Additional filtering and context are shown for the selected alert.
- Score
- Timeseries
- Events Over Time
- Top From
- Events by IP Addr
- From UA
- SIP Code
- SIP Method
- Events by Country
- Snapshot Comparison
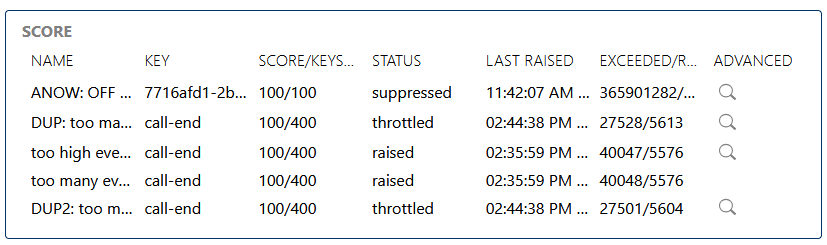
The Score metric provides a quick assessment of overall system health or risk, based on aggregated event and alert data. Use it to spot periods of stability or concern at a glance.
Review the score to quickly gauge system status and prioritize investigation.
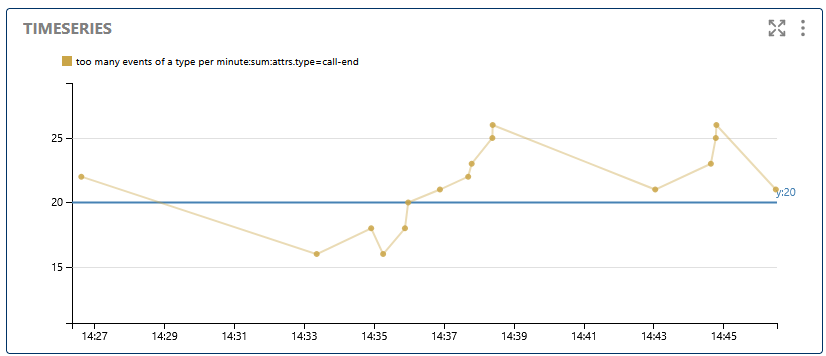
Visualizes event and alert data over time, helping you detect trends, anomalies, or recurring issues.
Use timeseries to monitor changes and spot patterns in system behavior.

Shows the volume of events over time, making it easier to correlate spikes with incidents or changes in the environment.
Track event frequency to identify periods of abnormal activity.
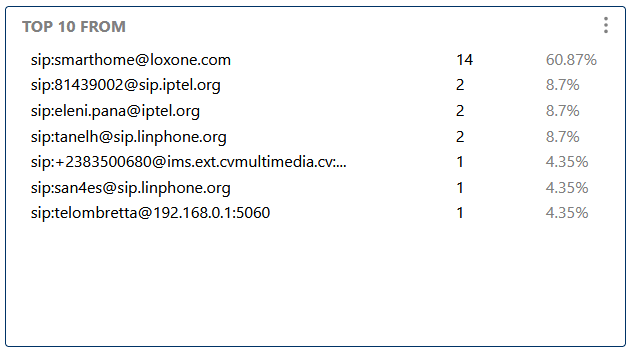
Highlights the most frequent sources (e.g., users, endpoints) of events, helping you identify key contributors to system activity or issues.
Focus on top sources to quickly find root causes or high-impact users.
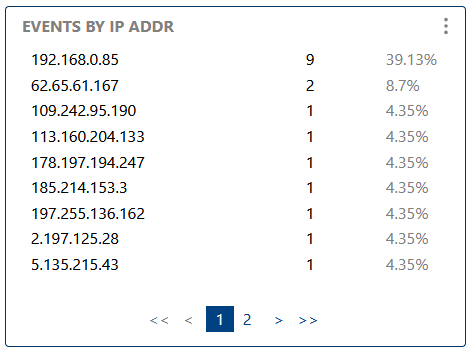
Breaks down events by originating IP address, useful for tracking network activity and identifying suspicious sources.
Use this to spot problematic IPs or distributed issues.
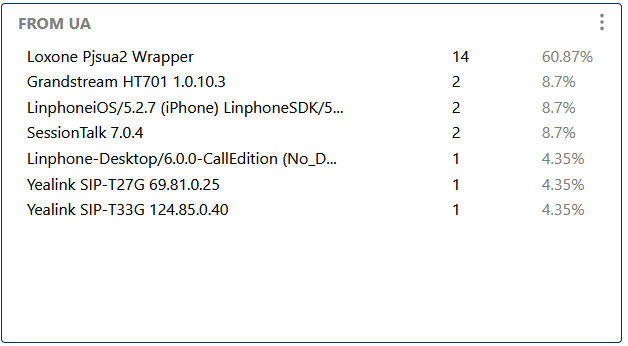
Shows the most common SIP User-Agents in event data, helping with device inventory and anomaly detection.
Monitor User-Agent trends to detect new devices or firmware changes.

Breaks down events by SIP response code, aiding in troubleshooting and identifying common failure reasons.
Analyze SIP codes to quickly diagnose call setup or teardown issues.

Visualizes the distribution of SIP methods (INVITE, BYE, REGISTER, etc.) in events, providing insight into call flows and protocol usage.
Use SIP method analysis to understand signaling patterns and detect anomalies.
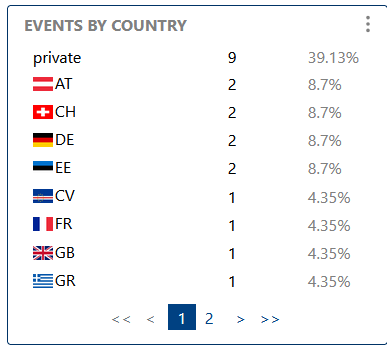
Shows the geographic distribution of events, helping you monitor international activity and spot regional issues.
Track events by country to detect unusual activity or compliance issues.
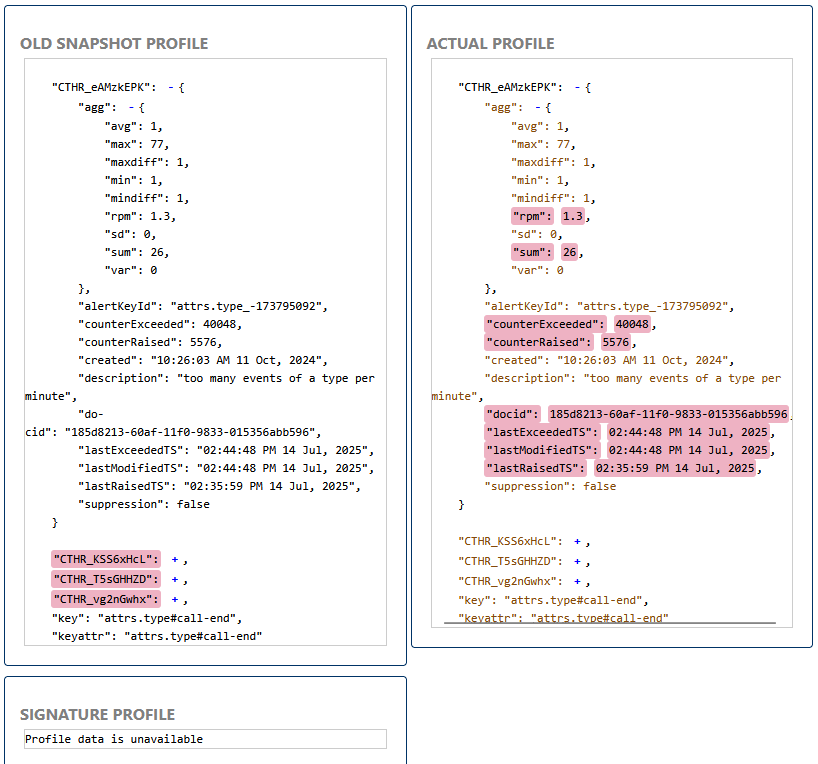
Compares two snapshots of system state or event data, making it easier to identify changes, regressions, or improvements.
Use snapshot comparison for before/after analysis and troubleshooting.