Conference Dashboard
Welcome to the Conference Dashboard! This page provides insights into conference activity, participation, and event trends. Use the tabs below to explore each metric in detail.
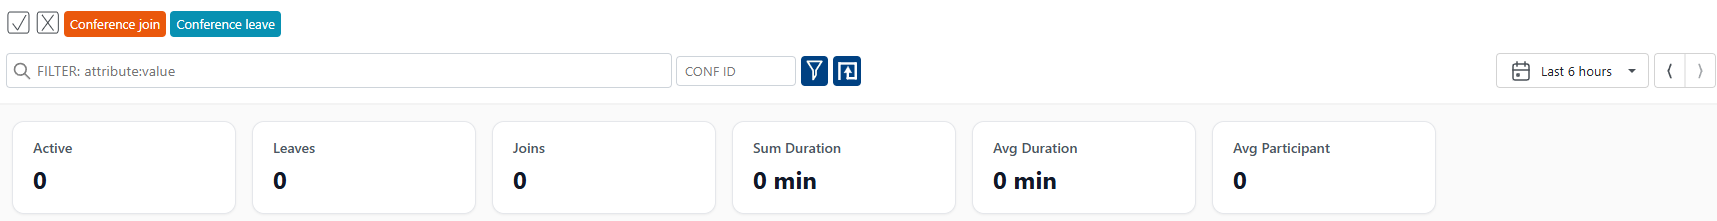
Main Cards in the Dashboard:
- ACTIVE: Shows the number of currently active conferences.
- LEAVEs: Counts the number of participants who have left conferences.
- JOINs: Counts the number of participants who have joined conferences.
- SUM DURATION: Displays the total duration of all conferences combined.
- AVG DURATION: Shows the average duration per conference.
- AVG PARTICIPANT: Indicates the average number of participants per conference.
Each card provides a quick overview of key conference metrics, helping you monitor activity and usage at a glance.
- Events Over Time
- Top Conferences
- Top Active Conferences
- Top Participants
- Conference Events

This chart shows the number of conference-related events over time, helping you spot trends, spikes, or periods of increased activity.
Track event frequency to identify patterns or unusual conference behavior.

Highlights the most frequently used conferences, helping you identify popular meeting rooms or recurring sessions.
Use this to monitor conference usage and spot high-traffic rooms.

Shows the conferences with the most ongoing activity, useful for real-time monitoring and resource allocation.
Monitor active conferences to ensure system capacity and performance.

Lists the most active participants across conferences, helping you identify key users or potential abusers.
Track participant activity to recognize power users or detect unusual behavior.

Lists individual conference events for detailed inspection, troubleshooting, and auditing.
Review conference events to investigate issues and monitor system health.