Diagnostics Dashboard
Welcome to the Diagnostics Dashboard! This page provides insights into system health, diagnostics events, and troubleshooting data. Use the tabs below to explore each metric in detail.
- Events Over Time
- Diagnostics Events

This chart shows the number of diagnostics events over time, helping you spot trends, spikes, or periods of increased activity.
note
Track diagnostics event frequency to identify patterns or unusual system behavior.
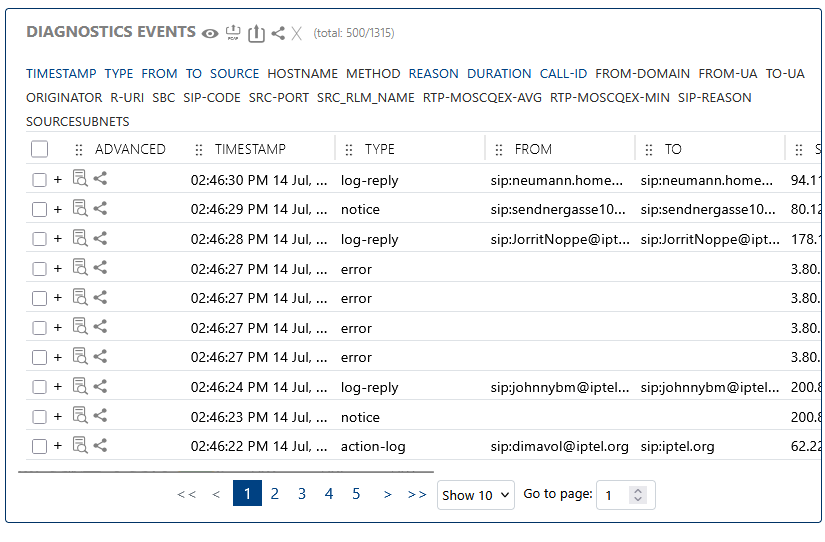
Lists individual diagnostics events for detailed inspection, troubleshooting, and system health monitoring.
info
Review diagnostics events to investigate issues and verify system status.