Network Dashboard
Welcome to the Network Dashboard! Here you can monitor real-time and historical network activity, security events, and interface statistics for your SBCs. Use the tabs below to explore each metric in detail.
Tip: Switch between tabs to analyze different aspects of your network and spot trends or anomalies.
- Parallel Calls by SBC
- Parallel Registrations by SBC
- Relayed Media by SBC
- IPs on FW Blacklist by SBC
- IPs on FW Greylist by SBC
- IPs on FW Whitelist by SBC
- TX Bytes by SBC
- RX Bytes by SBC
- TX Bytes by Interface
- RX Bytes by Interface
- TX Packets by SBC
- RX Packets by SBC
- TX Packets by Interface
- RX Packets by Interface
- Network Events
 Shows the number of simultaneous calls handled by each SBC, helping you monitor load and capacity.
Use this to identify peak usage times and potential bottlenecks.
 Displays the number of concurrent SIP registrations per SBC, useful for tracking registration surges.
Monitor for unexpected spikes that may indicate registration storms or attacks.
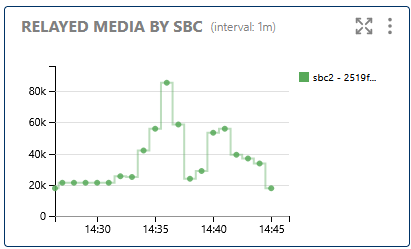 Visualizes the amount of media traffic relayed by each SBC, helping you assess media handling efficiency.
High relayed media may impact bandwidth and performance.
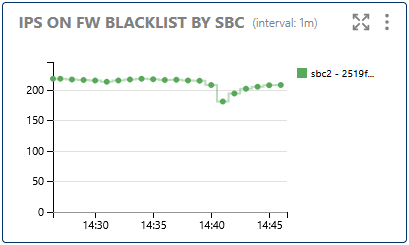 Lists IP addresses currently blacklisted by the firewall on each SBC, indicating blocked threats.
Regularly review blacklisted IPs to ensure legitimate users are not blocked.
 Shows IPs temporarily restricted by the firewall, often due to suspicious activity.
Greylisted IPs may be automatically removed after a timeout or further review.
 Displays trusted IPs allowed through the firewall, ensuring uninterrupted access.
Keep the whitelist updated to maintain security and connectivity.
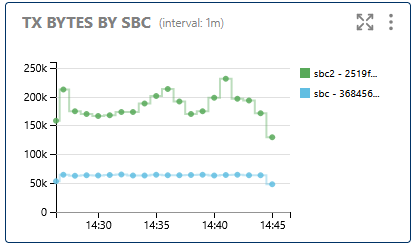 Shows the total bytes transmitted by each SBC, useful for bandwidth monitoring.
Track TX bytes to detect unusual outbound traffic patterns.
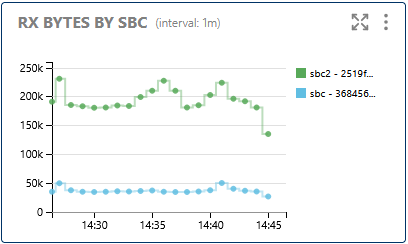 Displays the total bytes received by each SBC, helping you monitor inbound traffic.
Compare RX and TX bytes to identify asymmetric traffic flows.
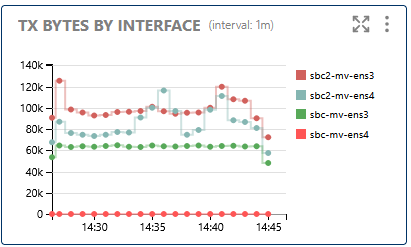 Breaks down transmitted bytes by network interface, aiding in interface-level diagnostics.
Use this to pinpoint overloaded or underutilized interfaces.
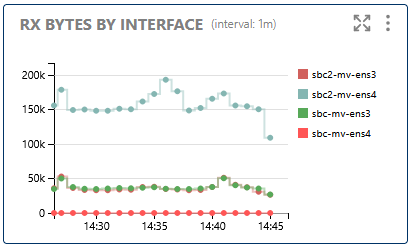 Breaks down received bytes by network interface for detailed analysis.
Useful for troubleshooting interface-specific issues.
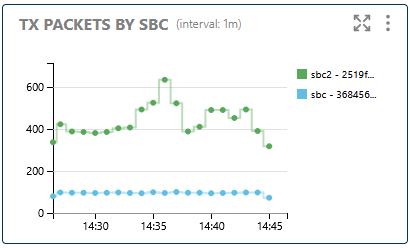 Shows the number of packets transmitted by each SBC, providing insight into network activity.
High packet rates may indicate heavy usage or potential flooding.
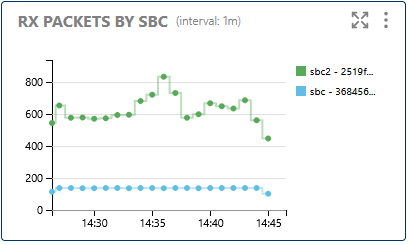 Displays the number of packets received by each SBC, helping you monitor inbound packet flow.
Sudden changes in RX packets may signal network issues.
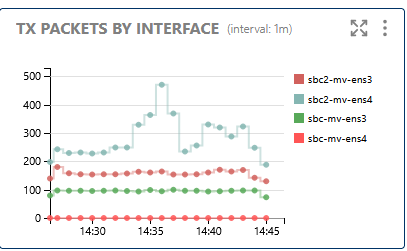 Breaks down transmitted packets by interface, useful for granular monitoring.
Identify which interfaces are handling the most traffic.
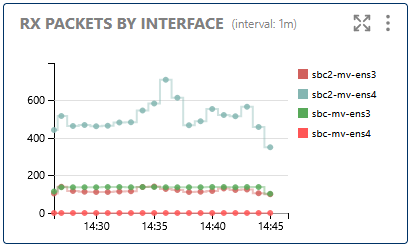 Breaks down received packets by interface for detailed troubleshooting.
Use this to detect interface-specific anomalies.
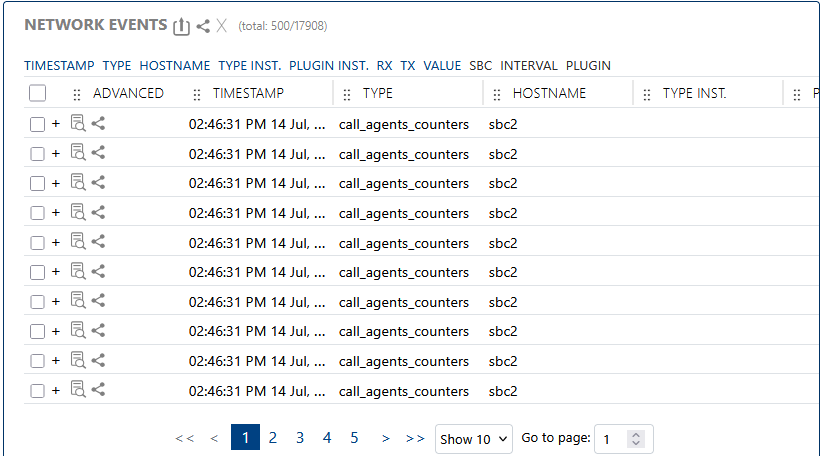 Lists significant network events, such as link changes, errors, or security alerts.
Review network events regularly to maintain system health and security.