Chart Visibility
The Chart Visibility feature allow you to hide and restore individual charts on any dashboard, this help you focus on the data that matter most by removing charts you don't need, without losing any data.
How It Works
Each chart on a dashboard can be individually hidden using the chart's options menu. Hidden charts are removed from the dashboard layout but not deleted, so they can be restored at any time through the hidden charts indicator in the top bar.
Chart visibility is per dashboard and per user profile. Hiding a chart on the Calls dashboard does not affect any other dashboard and your visibility preferences are independent of other users.
Hiding a Chart
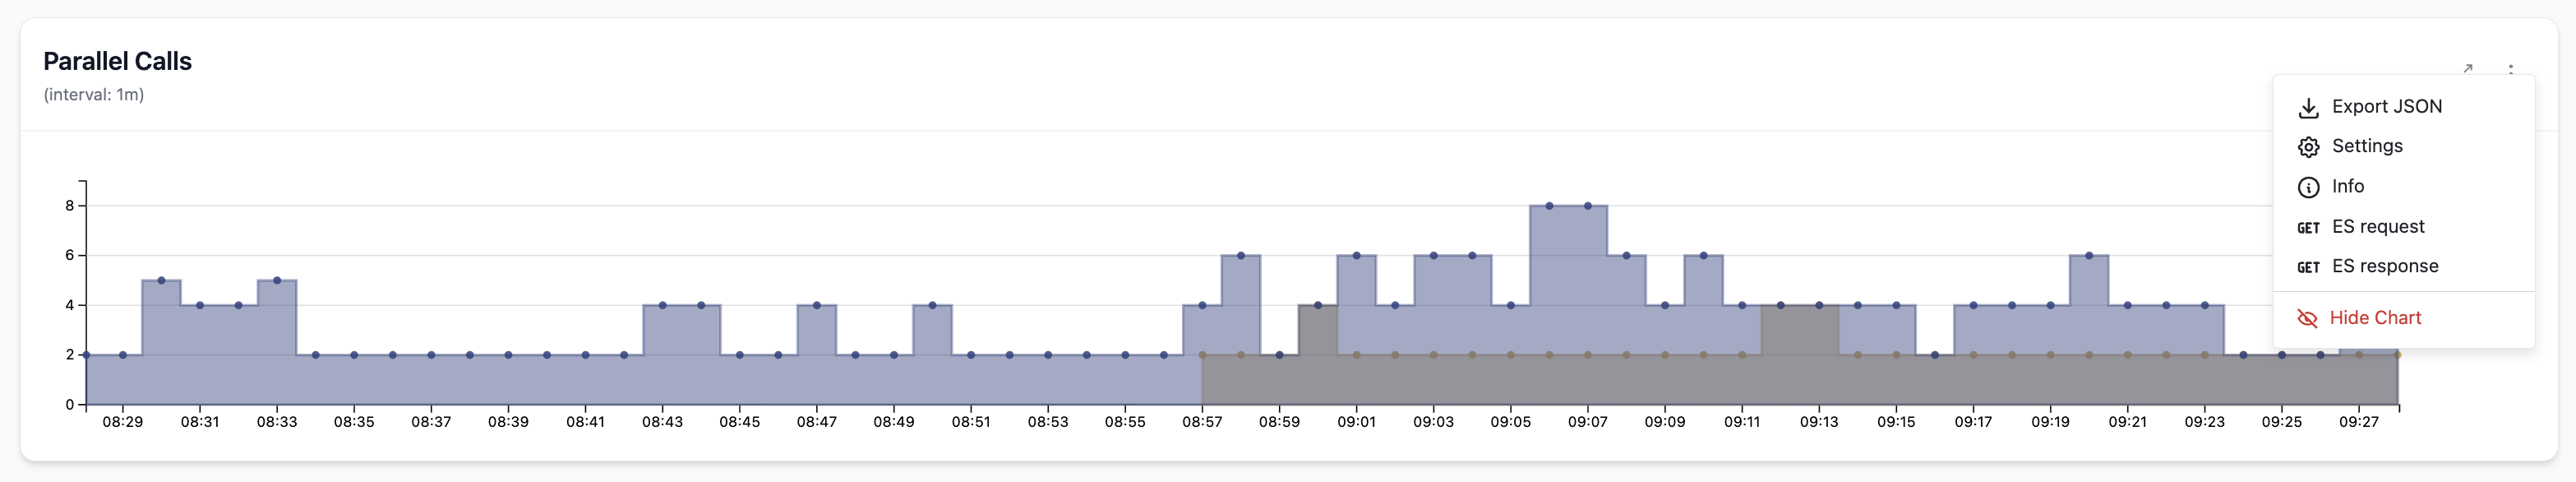
- Go to the chart you want to hide on your dashboard.
- Click the three dot menu in the top right corner of the chart.
- Select Hide Chart from the dropdown.
The chart disappears immediately from the dashboard. If this is the first chart you have hidden on this dashboard,, the hidden charts indicator will appear in the top bar.
Restoring Hidden Charts
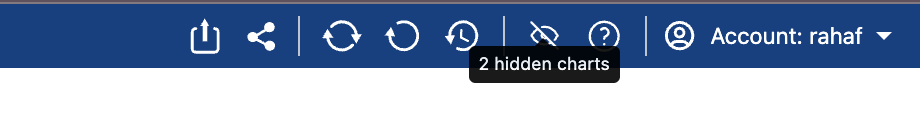
When one or more charts are hidden on the current dashboard, an eye icon appears in the top bar. Hovering over it shows a tooltip with the number of hidden charts.
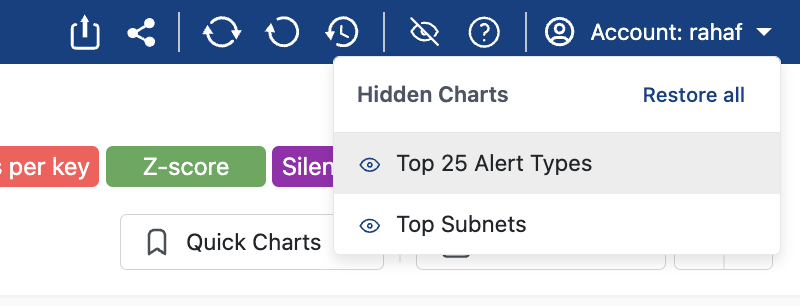
- Click the eye icon in the top bar.
- A dropdown appears listing all hidden charts by name, with a show action next to each.
- Click the eye icon next to any chart name to restore it to the dashboard.
- To restore all hidden charts at once, click Restore all at the top of the dropdown.
The indicator disappears from the top bar once all charts have been restored.
Saved Preferences
Your chart visibility preferences are saved to your user profile automatically,, this mean your hidden charts remain hidden. when you restore a chart then that change is also saved immediately.