10.1 -> 10.2
Summary
In the migration from Monitor 10.1 to 10.2, there a few important changes to be aware of:
Elasticsearch upgrade
During the migration from Monitor 10.1 to Monitor 10.2, Elasticsearch is upgraded from 7.x → 8.x → 9.x. Because a direct upgrade from 7.x to 9.x isn’t supported, the process uses an intermediate 8.x cluster to keep data compatible and safe.
Monitor 10.2 introduces changes to the database schema that require a migration process. Follow these steps to ensure a smooth transition:
-
Back up your data: Before starting the migration, ensure you have a complete backup of your current Monitor data and Elasticsearch indices. This is crucial to prevent data loss in case anything goes wrong during the migration process.
-
Start temporary Elasticsearch 8.x migration cluster: Start a temporary Elasticsearch
8.xinstance for the migration. Monitor10.2ultimately runs on Elasticsearch9.x, but the upgrade from7.x→9.xmust pass through8.x.tipCopy the Elasticsearch
8.xcompose file to your working directory where yourcompose fileis located so the volume are going to match between theproductionand themigrationvolume.monitor/
├─ docker-compose.yml # production compose
├─ .env # production env file
├─ docker-compose.esUpgrade8.yml # migration compose for Elasticsearch 8.x
└─ docker-compose.esUpgrade9.yml # migration compose for Elasticsearch 9.xIf the folder is different then the volumes references are prepending the folder name to the volume, so make sure the volume names are matching.
-
Start the Elasticsearch service using Docker Compose:
docker-compose -f docker-compose.esUpgrade8.yml up -dShow example
docker-compose.yml⬇️ Download docker-compose.esUpgrade8.ymldocker-compose.ymlservices:
elastic:
image: docker.elastic.co/elasticsearch/elasticsearch:8.19.5
container_name: elastic-migration-container-8
ports:
- "9200:9200" # HTTP API
- "9300:9300" # Transport protocol
environment:
- node.name=elastic-node-migration8
- discovery.type=single-node # Run as single node
- xpack.ml.enabled=false # Disable ML features
- xpack.security.enabled=false # Disable security
- xpack.security.http.ssl.enabled=false # Disable HTTP SSL
- logger.level=info # Set log level to info
- ES_JAVA_OPTS=-Xms6g -Xmx6g # Set JVM heap size
volumes:
- es-data:/usr/share/elasticsearch/data # Data volume
volumes:
es-data: -
wait until Elasticsearch is fully started and operational. Open the Elasticsearch web interface at
http://<server_ip>:9200/_cat/indices?v=true--> all of the indices should be in green state.
-
-
Run the migration script on Elasticsearch 8.x: Use the provided migration script located in the
migrationsdirectory of the Monitor repository. Execute the script with the following command:warningMake sure the script at the end of the migration from the version
8.xto9.xis executed and not exited as the same instance will be used in the step#6../migrateToEs9.shtipif you cannot run the script as it is not an executable, you can change the permissions with:
chmod +x ./migrateToEs9.sh-
during the full process the script will be also outputting the logs into the file
runtime.log -
at the end of the script execution, you should see a message indicating that the migration to Elasticsearch
8.xwas successful and Elasticsearch9.xcan be started.
info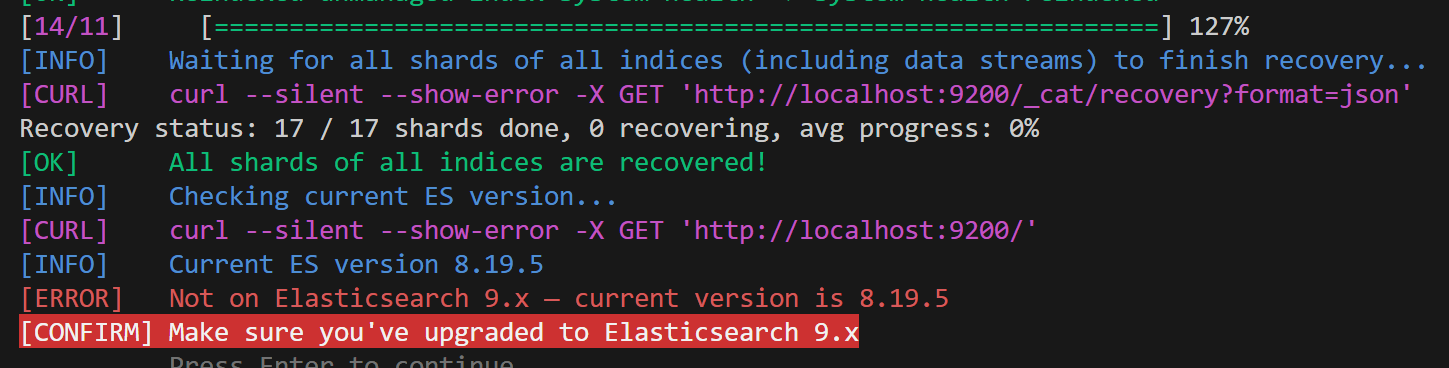
-
-
Verify migration and deprecations: After the migration script has completed, verify that all data has been successfully migrated by checking the Monitor application and ensuring that all previous data is accessible.
- when chekcing the URL
http://<server_ip>:9200/_migration/deprecations?pretty--> no entry should be mentioned in the output
{
 "cluster_settings" : [ ],
 "node_settings" : [ ],
 "ilm_policies" : { },
 "data_streams" : { },
 "index_settings" : { },
 "templates" : { }
} - when chekcing the URL
-
Start Elasticsearch 9.x: After confirming that the migration to Elasticsearch
8.xwas successful, you can now upgrade to Elasticsearch9.x.-
Run the Elasticsearch
9.xcompose file to start Elasticsearch version9.x. -
Start the Elasticsearch service using Docker Compose:
docker-compose -f docker-compose.esUpgrade9.yml up -dShow example
docker-compose.yml⬇️ Download docker-compose.esUpgrade9.ymldocker-compose.ymlservices:
elastic:
image: docker.elastic.co/elasticsearch/elasticsearch:9.1.5
container_name: elastic-migration-container-9
ports:
- "9200:9200" # HTTP API
- "9300:9300" # Transport protocol
environment:
- node.name=elastic-node-migration9
- discovery.type=single-node # Run as single node
- xpack.ml.enabled=false # Disable ML features
- xpack.security.enabled=false # Disable security
- xpack.security.http.ssl.enabled=false # Disable HTTP SSL
- logger.level=info # Set log level to info
- ES_JAVA_OPTS=-Xms6g -Xmx6g # Set JVM heap size
volumes:
- es-data:/usr/share/elasticsearch/data # Data volume
volumes:
es-data: -
wait until Elasticsearch is fully started and operational. Open the Elasticsearch web interface at
http://<server_ip>:9200/_cat/indices?v=true--> all of the indices should be in green state.
noteThe loading of the
Elasticsearchapplication may take some time depending on your system resources and the size of your database. Please be patient while the migration process completes.You can monitor the progress by going to the
http://<server_ip>:9200/_cat/indices?v=trueas the states of the indices will change fromyellow/redtogreenafter some time, so please be patient. -
-
Continue migration checks on Elasticsearch 9.x: Now you can continue with the next steps of the
Elasticsearch upgradeprocess to version9.xby pressing enter in the window- at the end of the script it will show you that all shards/tasks are completed
info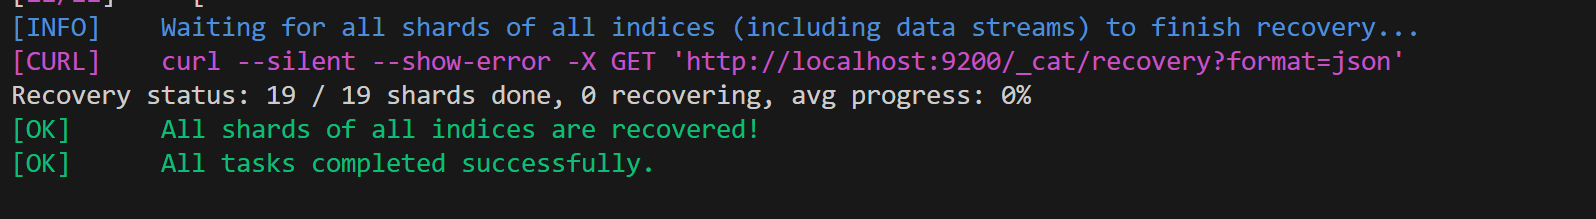
- if the previous sessions was stopped you can re-run the script again with the same command and it will continue from the last step
-
Stop migration containers and start regular Monitor stack:
Stopthe Elasticsearch migration containers mentioned above and start your regular Monitor containers as per your standard setup.infoMake sure you don't remove the volume that houses your migrated Elasticsearch data.
Data Volume Permissions
Impact: High
Data Volume Description
If your deployment mounts an existing /data volume into the Monitor container, you may encounter permission errors when the container attempts to create directories or write data.
This issue occurs because earlier versions of Monitor ran their processes under different users — root, mokis, elasticsearch, or sbcsync — meaning that files on the mounted volume may be owned by various user accounts.
Starting with version 10.2, the container now runs as a non-root user (node, UID 1000), which no longer has permission to modify those existing files or create new ones on the same volume.
Data Volume Solution
To determine if your mounted volume has the correct permissions, execute the following command:
ls -la /path/to/mounted-data/
This will display the current ownership and permission settings of the directory.
For example, the original Monitor 5.3 directory structure:
(mon) / # ls -la /data
total 36
drwxr-xr-x 9 root          root          4096 Oct 22 15:28 .
dr-xr-xr-x 1 root          root          4096 Oct 22 15:40 ..
drwxrwxr-x 4 mokis         mokis         4096 Nov  4 09:46 abc-monitor
drwxr-xr-x 2 elasticsearch elasticsearch 4096 Oct 22 15:28 elasticsearch
drwxr-xr-x 2 root          root          4096 Oct  1 08:32 interfaces.d
drwxr-xr-x 2 root          root          4096 Oct 22 15:28 local-templates
drwxr-xr-x 2 root          root          4096 Oct 22 15:28 prompts
drwxr-xr-x 4 sbcsync       sbcsync       4096 Oct 22 15:28 sbcsync
drwxr-xr-x 2 root          root          4096 Oct 22 15:28 siprec_templates
Method 1 (Preferred): Mount the directory using the :U option.
This tells Podman to automatically adjust the ownership of the mounted directory so it matches the container’s user namespace.
-v /path/to/mounted-data:/data:U
Method 2: Manually change the ownership of the directory to match the user running inside the container.
chown -R 1000 /path/to/mounted-data/
This command recursively changes the ownership (both user and group) of all files and directories to UID and GID 1000, which corresponds to the default node user in the Monitor container.
Both methods can be slow on large directory trees, as they must update the ownership of every file recursively.
Static PDF Reports Removed — Replaced by Auto Trigger Dashboard
Impact: Medium
PDF Description
The built-in static PDF reports have been removed in version 10.2. This configuration allowed scheduling daily, weekly, and monthly PDF snapshots of the overview dashboard via the Monitor page, delivered to configured notification channels through a headless Chrome container.
The following Settings no longer exist:
| Setting | Purpose in 10.1 |
|---|---|
Enable receiving PDF reports | Toggle for enabling the static PDF reports |
Headless Chrome URL for PDF reports | URL of the headless Chrome container |
Report daily - channels | Channels to deliver the daily report |
Report weekly - channels | Channels to deliver the weekly report |
Report monthly - channels | Channels to deliver the monthly report |
These settings are automatically removed from the database during upgrade. If you had report channels configured, those scheduled jobs will no longer run after upgrading. No data is lost — your notification channels remain intact and can be reused in Auto Trigger.
Why it was removed
The old reports had several hard limitations: report content was fixed to the overview dashboard, there was no control over what data was included, no execution history, no way to share or export job configurations, and no support for output formats other than PDF. Auto Trigger replaces all of this with a fully configurable job scheduler.
What replaces it
Auto Trigger is the new system for scheduled report delivery. It provides:
Migration steps
Scheduled report jobs cannot be migrated automatically because the old report system used a fixed internal dashboard query with no user-defined data selection.
To ease the transition, three starter jobs are pre-created automatically during upgrade and are available immediately in the Auto Trigger dashboard:
| Job | Schedule |
|---|---|
| Daily Report | Every day at 6 AM (0 6 * * *) |
| Weekly Report | Every Monday at 6 AM (0 6 * * 1) |
| Monthly Report | 1st of every month at 6 AM (0 6 1 * *) |
These jobs come with a basic call events query pre-configured and output set to JSON. They are enabled by default.
To activate and customize your reports:
- Open the Auto Trigger dashboard from the left navigation.
- Create new entry or update the existing by default created ones.
- Update the
data.selectionqueries to match the data you need. - Set
formatChannelto your preferred output format —toPdf,toHtml,toCsv, ortoJson. See the Report Generation guide. - Add your channel IDs to the
transportarray to restore delivery to your existing notification channels. - Click Save, then Run Now to validate the output before the first scheduled run.